

Question: GRADE 11- STAT WK4: 3:20 0 #. STAT_G11_Q2M4_WK4.... ... Let's Apply Direction: Solve the following problems below. Fill in the blanks with the correct value/s
GRADE 11- STAT
WK4:
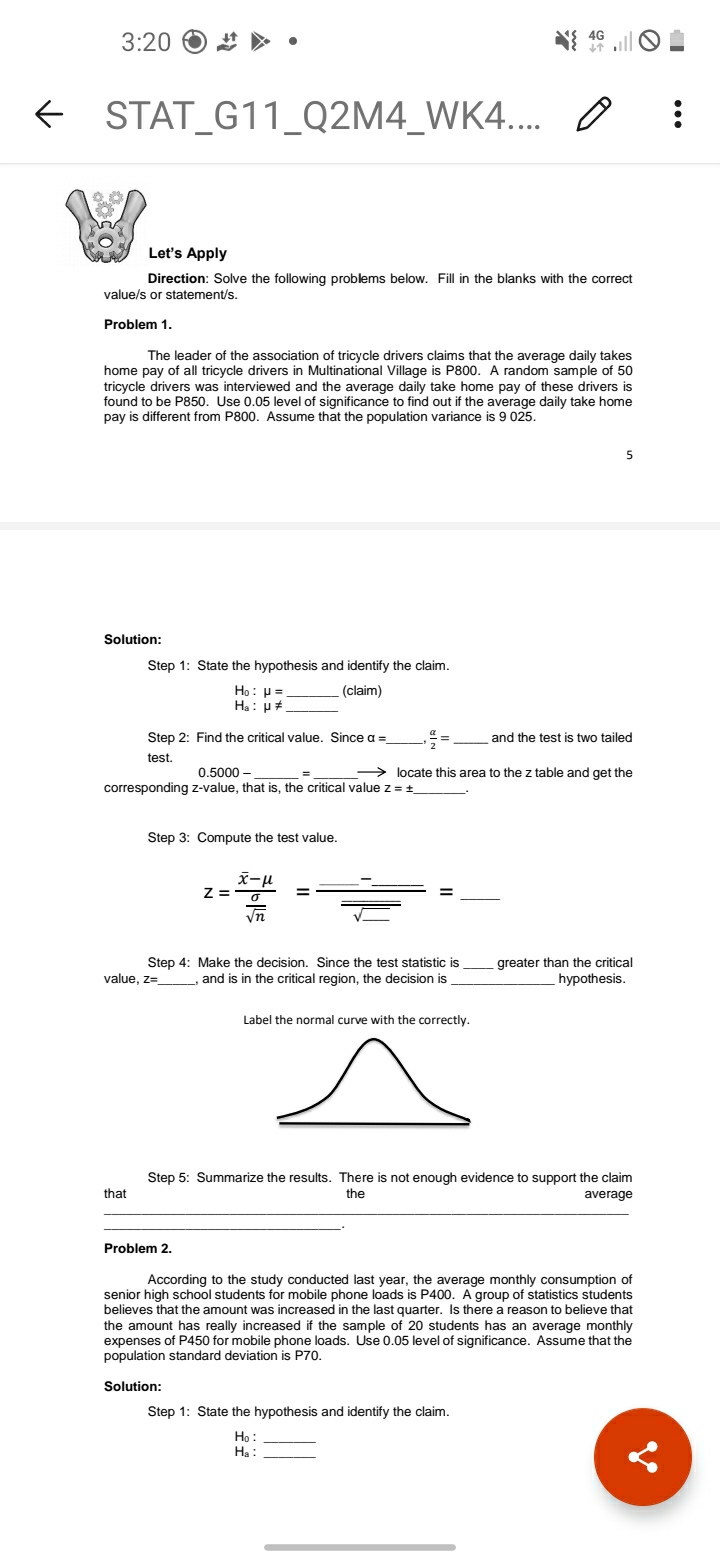
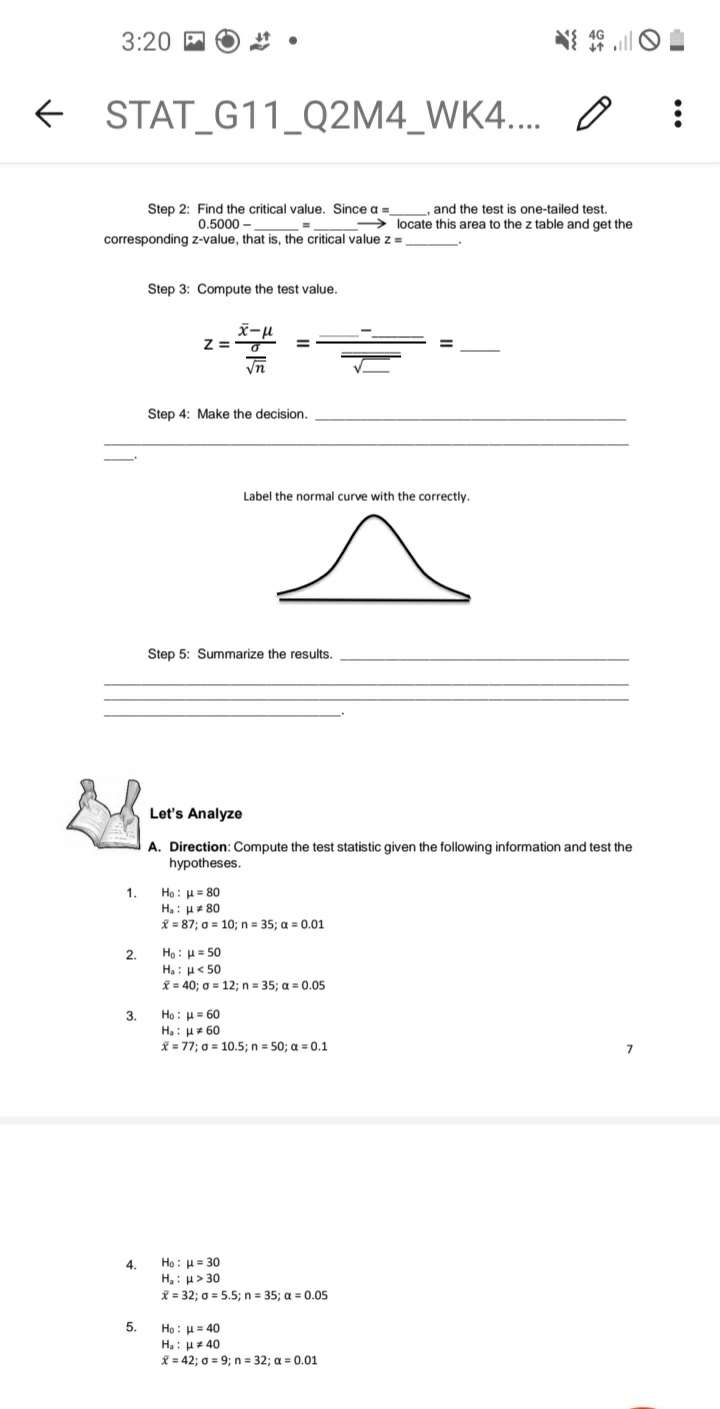
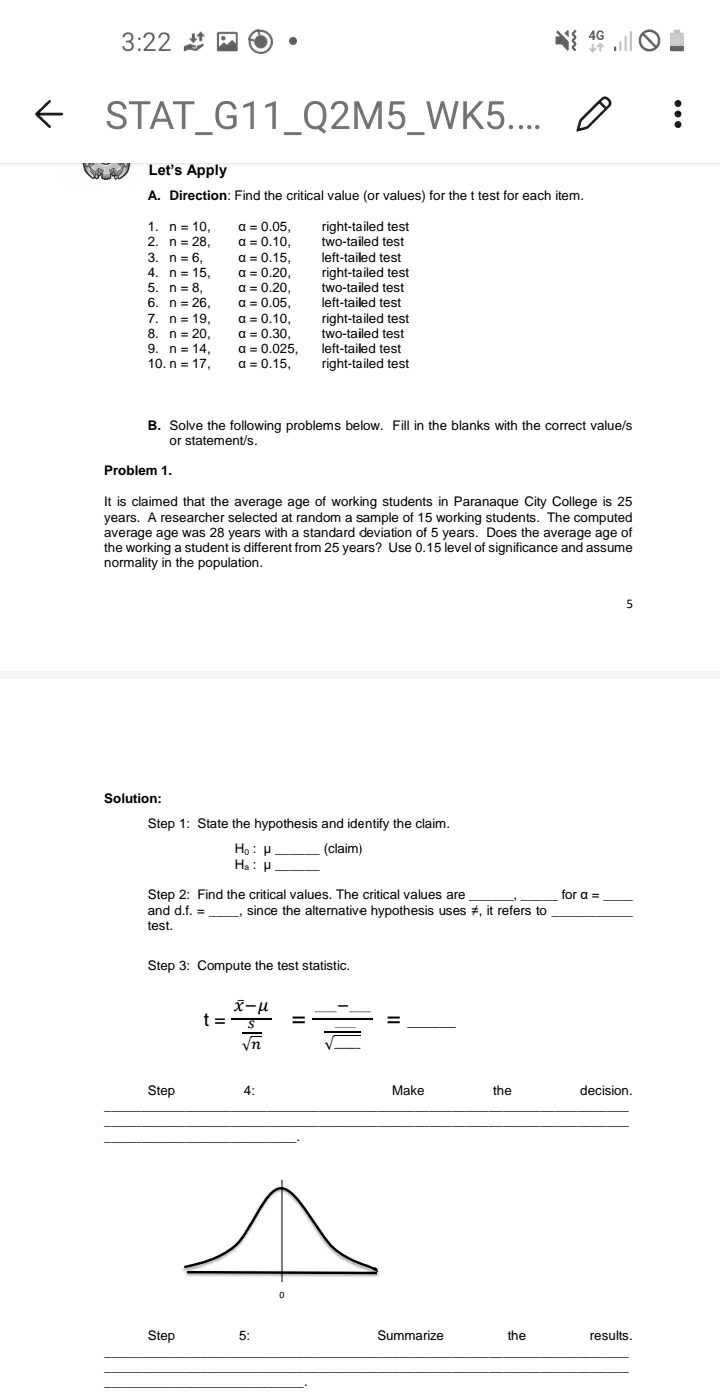
3:20 0 #. STAT_G11_Q2M4_WK4.... ... Let's Apply Direction: Solve the following problems below. Fill in the blanks with the correct value/s or statement/s. Problem 1. The leader of the association of tricycle drivers claims that the average daily takes home pay of all tricycle drivers in Multinational Village is P800. A random sample of 50 tricycle drivers was interviewed and the average daily take home pay of these drivers is found to be P850. Use 0.05 level of significance to find out if the average daily take home pay is different from P800. Assume that the population variance is 9 025. 5 Solution: Step 1: State the hypothesis and identify the claim. Ho : H = (claim) Ha : p # Step 2: Find the critical value. Since a =_ and the test is two tailed test. 0.5000 - -> locate this area to the z table and get the corresponding z-value, that is, the critical value z = 1. Step 3: Compute the test value. Z= X - H Step 4: Make the decision. Since the test statistic is greater than the critical value, z=. , and is in the critical region, the decision is hypothesis. Label the normal curve with the correctly. Step 5: Summarize the results. There is not enough evidence to support the claim that the average Problem 2. According to the study conducted last year, the average monthly consumption of senior high school students for mobile phone loads is P400. A group of statistics students believes that the amount was increased in the last quarter. Is there a reason to believe that the amount has really increased if the sample of 20 students has an average monthly expenses of P450 for mobile phone loads. Use 0.05 level of significance. Assume that the population standard deviation is P70. Solution: Step 1: State the hypothesis and identify the claim. Ho : Ha :3:20 0 4 . STAT_G11_Q2M4_WK4.... ... Step 2: Find the critical value. Since a =_ , and the test is one-tailed test. 0.5000 - -> locate this area to the z table and get the corresponding z-value, that is, the critical value z = _ Step 3: Compute the test value. Z= Step 4: Make the decision. Label the normal curve with the correctly. Step 5: Summarize the results. Let's Analyze A. Direction: Compute the test statistic given the following information and test the hypotheses. 1. Ho : H = 80 Ha : H x 80 X = 87; a = 10; n = 35; a = 0.01 2. Ho : H = 50 Ha : H 30 x = 32; 0 = 5.5; n = 35; a = 0.05 5. Ho : H = 40 Ha : H = 40 = 42; 0 = 9; n = 32; a = 0.01Let's Evaluate Direction: Solve the following problems. Show the step by step process. 1. It is claimed that the mean annual salary of a Teacher | is P254 000. A researcher randomly selected 40 Teachers I faculty members of SHS. He computed the mean of their annual salaries and obtained a mean of P260 000. Does this show that the mean salary of teachers I is greater than P254 000? Use 0.05 level of significance, and assume that the population standard deviation is P4000. 2. A company which produces batteries claims that the life expectancy of their batteries is 96 hours. In order to test the claim, a consumer interest group tested a random sample of 40 batteries. The test resulted to a mean life expectancy of 84 hours. Using the level of significance of 0.01, can it be concluded that the life expectancy of their batteries is less than 96 hours? Assume that the population standard deviation is known to be 22 hours.3:22 # O NE 4G STAT_G11_Q2M5_WK5.... ... Let's Apply A. Direction: Find the critical value (or values) for the t test for each item. 1. n = 10, a = 0.05, right-tailed test 2. n = 28, a = 0.10, two-tailed test 3. n =6, a = 0.15, left-tailed test 4. n = 15, a = 0.20, right-tailed test 5. n= 8, a = 0.20, two-tailed test 6. n = 26, a = 0.05, left-tailed test 7. n = 19, a = 0.10, right-tailed test 8. n = 20, a = 0.30, two-tailed test 9. n = 14, a = 0.025, left-tailed test 10. n = 17, a = 0.15, right-tailed test B. Solve the following problems below. Fill in the blanks with the correct value/s or statement/s. Problem 1. It is claimed that the average age of working students in Paranaque City College is 25 years. A researcher selected at random a sample of 15 working students. The computed average age was 28 years with a standard deviation of 5 years. Does the average age of the working a student is different from 25 years? Use 0.15 level of significance and assume normality in the population. 5 Solution: Step 1: State the hypothesis and identify the claim. Ho : H (claim) Ha : P Step 2: Find the critical values. The critical values are for a = and d.f. = since the alternative hypothesis uses #, it refers to test. Step 3: Compute the test statistic. X-u t = Step 4: Make the decision. Step 5: Summarize the results.3:22 # STAT_G11_Q2M5_WK5.... ... Problem 2. Last year the average cost of making a movie was P54.8 million. This year, a random sample of 15 action movies had an average production cost of P62.3 million with a sample variance of P90.25 million. At the 0.05 level of significance, can it be concluded that it costs more than the average to produce an action movie? Solution: Step 1: State the hypothesis and identify the claim. Ho : H (claim) Ha : p 6 Step 2: Find the critical value. The critical value is for a = and d.f. = , since the alternative hypothesis uses it refers to test. Step 3: Compute the test statistic. x-ul t= Step Make the decision. Step 5: Summarize the results.3:22 # STAT_G11_Q2M5_WK5.... ... Let's Analyze A. Direction: Compute the test statistic given the following information and test the hypotheses. 1. Ho : H = 35 Ha : H x 35 Y = 37; s = 4; n = 15; a = 0.01 2. Ho : H = 50 Ha : H 60 X = 77; s = 8.5; n = 20; a = 0.1 4. Ho : H = 30 Ha : H
Step by Step Solution
There are 3 Steps involved in it

Get step-by-step solutions from verified subject matter experts