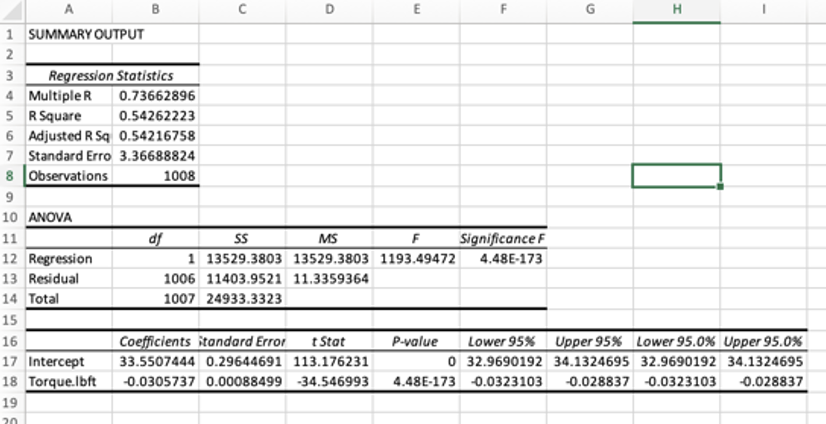
Question: Graph 1) A B C D E F G H 1 SUMMARY OUTPUT 2 Regression Statistics Multiple R 0.73662896 5 R Square 0.54262223 6 Adjusted

Graph 1)

Graph 1) A B C D E F G H 1 SUMMARY OUTPUT 2Graph 1) A B C D E F G H 1 SUMMARY OUTPUT 2
A B C D E F G H 1 SUMMARY OUTPUT 2 Regression Statistics Multiple R 0.73662896 5 R Square 0.54262223 6 Adjusted R Sq 0.54216758 7 Standard Erro 3.36688824 8 Observations 1008 9 10 ANOVA 11 df SS MS F Significance F 12 Regression 1 13529.3803 13529.3803 1193.49472 4.48E-173 13 Residual 1006 11403.9521 11.3359364 14 Total 1007 24933.3323 15 16 Coefficients itandard Error t Stat P-value Lower 95% Upper 95% Lower 95.0% Upper 95.0% 17 Intercept 33.5507444 0.29644691 113.176231 0 32.9690192 34.1324695 32.9690192 34.1324695 18 Torque.Ibft -0.0305737 0.00088499 -34.546993 4.48E-173 -0.0323103 -0.028837 -0.0323103 -0.028837 19G H K M O Q R 1 Brand Model. Number Photo Engine. Type Body. Type Fuel.Type Gearbox.Ty Drivetrain Price Power.hp Displaceme Torque.Ibft Cylinders Seats Doors Height. in Length.in Width.in Wheelbase MPG. City MPG. Highu AvgMPG Honda Accord Hybrid Sport-L: https://ww 2.OL Inline-4 Hybrid Sedan Hybrid CVT front 31670 204 247 5 4 57.1 196.1 73.3 111.4 44 41 42.5 Honda Accord Sedan 2023 https://ww 1.5L Turbo Inline-4 Gas Sedan Petrol front 28000 192 260 57.1 196.1 73.3 111.4 30 34

Step by Step Solution

There are 3 Steps involved in it

1 Expert Approved Answer
Step: 1 Unlock blur-text-image
Question Has Been Solved by an Expert!

Get step-by-step solutions from verified subject matter experts

Step: 2 Unlock
Step: 3 Unlock

Students Have Also Explored These Related Finance Questions!