

Question: Graph 1 Graph 2 6. Which graph represents the correct depiction of the M2 measure for the (Portfolio + BA)? a. Graph 1 b. Graph
Graph 1 Graph 2
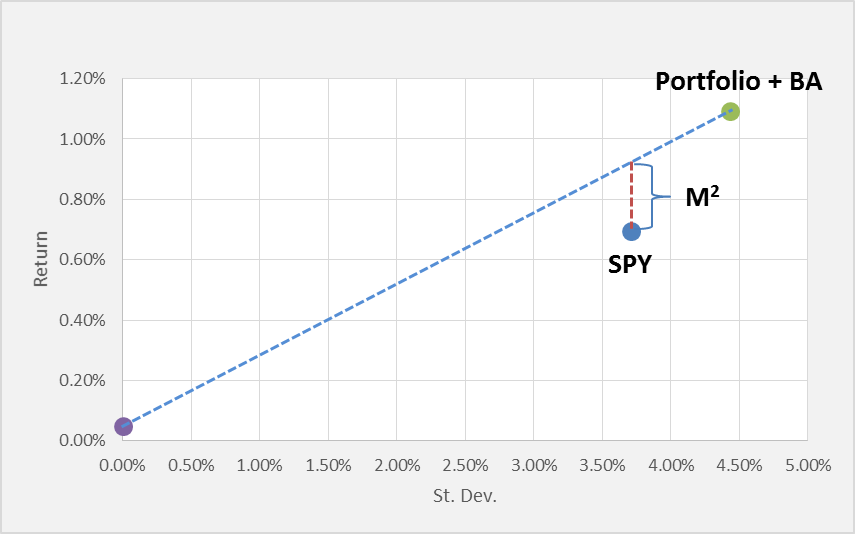
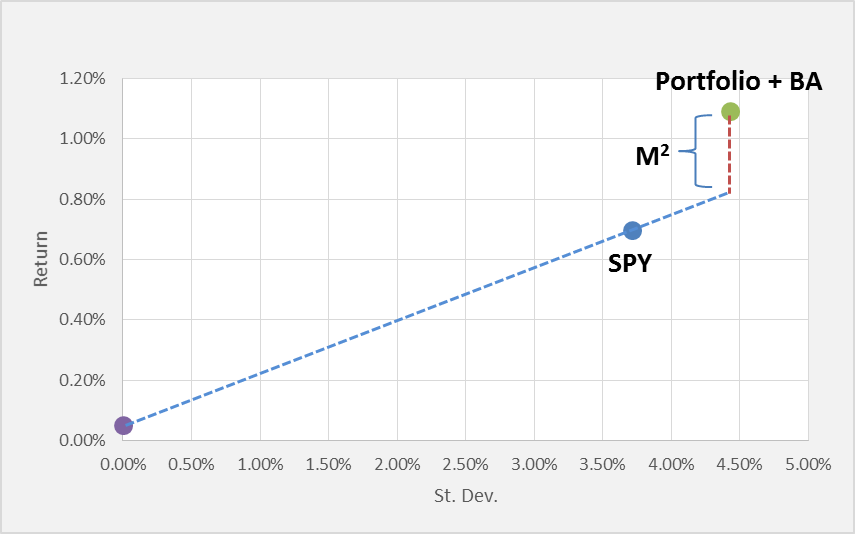
6. Which graph represents the correct depiction of the M2 measure for the (Portfolio + BA)?
a. Graph 1
b. Graph 2
c. Neither one
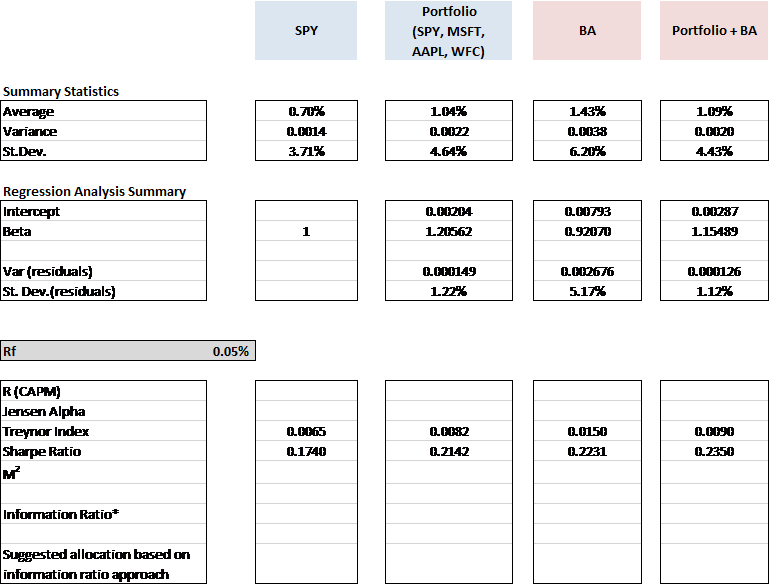
Portfolio (SPY, MSFT, AAPL, WFC) SPY BA Portfolio +BA Summary Statistics Regression Analysis Summary 0.05% 1.20% Portfolio + BA 1.00% 0.80% M2 0.60% SPY 0.40% 0.20% 0.00% 0.00% 0.50% 1.00% 1.50% 2.00% 2.50% 3.00% 3.50% 4.00% 4.50% 5.00% St. Dev. 1.20% Portfolio + BA 1.00% M2 0.80% 0.60% SPY 0.40% 0.20% 0.00% 0.00% 0.50% 1.00% 1.50% 2.00% 2.50% 3.00% 3.50% 4.00% 4.50% 5.00% St. Dev
Step by Step Solution
There are 3 Steps involved in it
1 Expert Approved Answer
Step: 1 Unlock

Question Has Been Solved by an Expert!
Get step-by-step solutions from verified subject matter experts
Step: 2 Unlock
Step: 3 Unlock