

Question: Graph 4 : Michaelis - Menten plot: Initial rate of change as a function of [ ONPG ] ( OD 4 2 0 / minute
Graph : MichaelisMenten plot: Initial rate of change as a function of ONPG
ODminute vsONPG
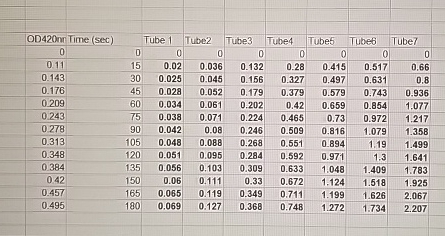
a Table : Time course of inhibitor on OD
b Graph : All time course with inhibitor data combined OD vs time
c Graph : MichaelisMenten plot: Initial rate of change with inhibitor as a function of
ONPGODminute vsONPG please use the data below to answer these questions.
tableODmTime secTube TubeTubeTubeTubeTubeTubel
Step by Step Solution
There are 3 Steps involved in it
1 Expert Approved Answer
Step: 1 Unlock

Question Has Been Solved by an Expert!
Get step-by-step solutions from verified subject matter experts
Step: 2 Unlock
Step: 3 Unlock