

Question: Physics : Motion (Please contain detailed explanations) Given information: PURPOSE You will use the PhET simulation The Moving Man to investigate the relationships between position,
Physics : Motion
(Please contain detailed explanations)
Given information:
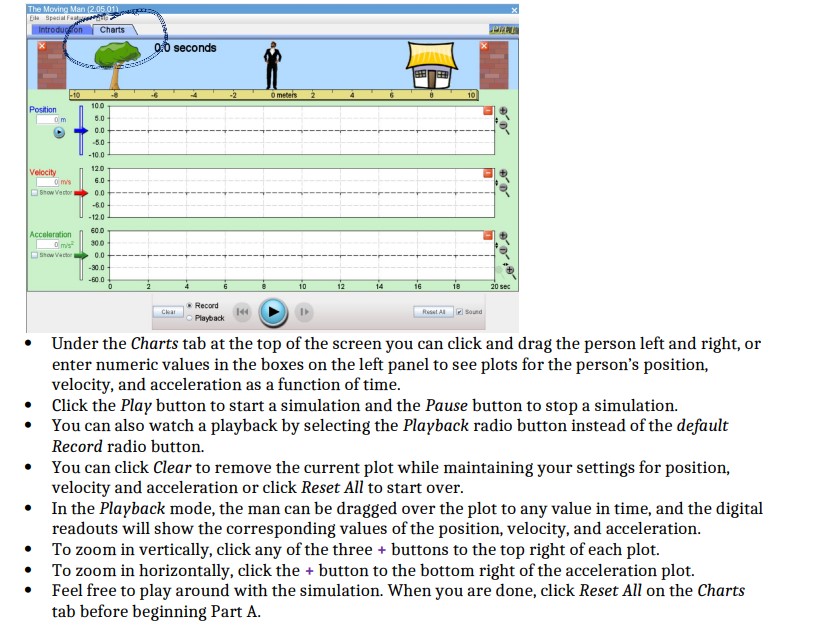
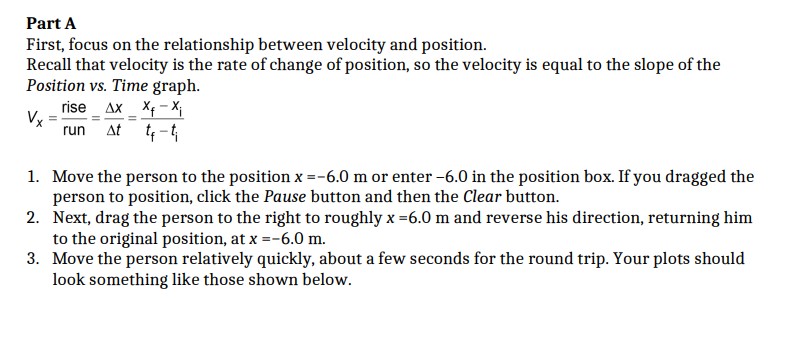
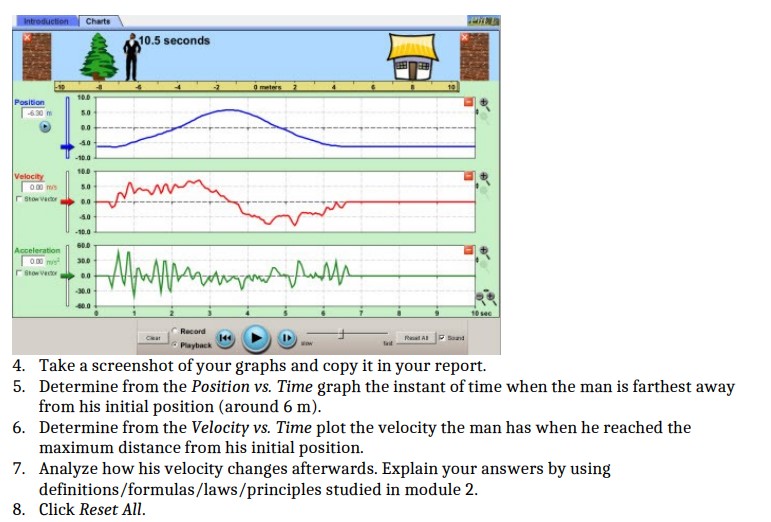
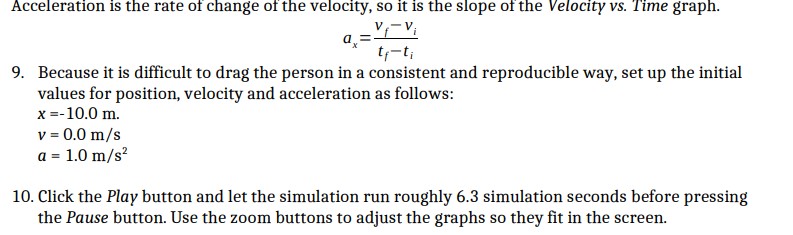

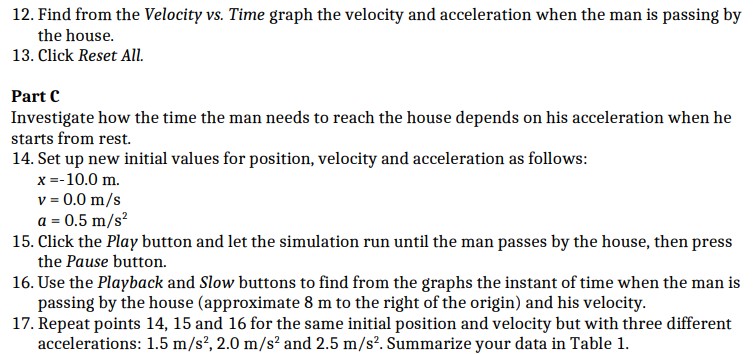

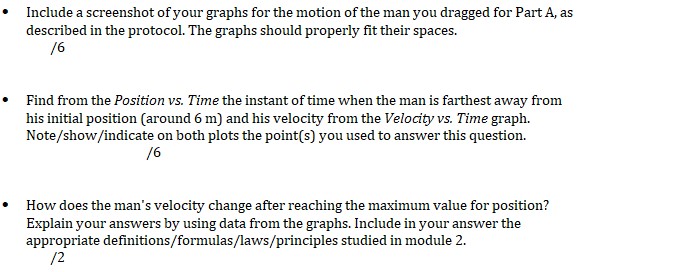
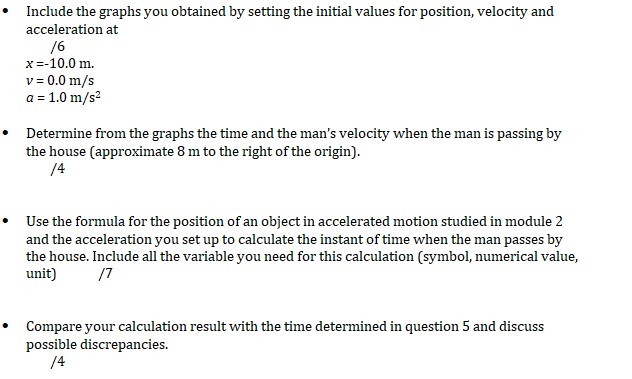
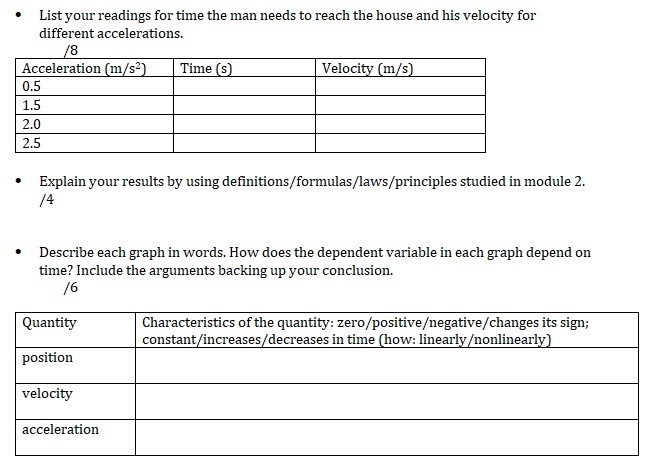
PURPOSE You will use the PhET simulation The Moving Man to investigate the relationships between position, velocity, and acceleration. This online lab has been adapted from resources at PhET Interactive Simulations project at the University of Colorado Boulder. NOTE: These activities use Java as well as an alternate browser-compatible version run by CheerpJ (Learning Technologies). Therefore, they are not screen-reader accessible and may not work on a mobile device. If the browser you're using no longer supports Java, try a different browser and download the Java plugin for this content. PROCEDURE Go to https://phet.colorado.edu/en/simulations/moving-man then click on the arrow to open the Web-compatible simulation The Moving Man. This simulation allows you to drag a person back and forth and look at the resulting position, velocity, and acceleration. You can also enter initial values for position, velocity and acceleration.The Moving Man (2.05.011 Introduction Charts Q:0 seconds -10 -2 0 meters 2 19 Position 100 Om 0.0- 5.0- Velocity 120 6.0- -60- -12 0 Accolanation 0.0 -30.0 -60.0 2 10 12 14 18 20 sec Record Chal - Playback 141 Ross! Al ] Sound . Under the Charts tab at the top of the screen you can click and drag the person left and right, or enter numeric values in the boxes on the left panel to see plots for the person's position, velocity, and acceleration as a function of time. Click the Play button to start a simulation and the Pause button to stop a simulation. You can also watch a playback by selecting the Playback radio button instead of the default Record radio button. . You can click Clear to remove the current plot while maintaining your settings for position, velocity and acceleration or click Reset All to start over. . In the Playback mode, the man can be dragged over the plot to any value in time, and the digital readouts will show the corresponding values of the position, velocity, and acceleration. To zoom in vertically, click any of the three + buttons to the top right of each plot. To zoom in horizontally, click the + button to the bottom right of the acceleration plot. . . Feel free to play around with the simulation. When you are done, click Reset All on the Charts tab before beginning Part A.Part A First. focus on the relationship between velocity and position. Recall that velocity is the rate of change of position. so the velocity is equal to the slope of the Position vs. Time graph. Vxj= "f'xi _run_ar tfi'i 1. Move the person to the position x =-6.U r11 or enter 6.0 in the position box. Hyou dragged the person to position, click the Pausa button and then the Clear button. 2. Next, drag the person to the right to roughly 2:: =61} m and reverse his direction, returning him to the original position, at x =-6.U In. 3. Move the person relatively quickly, about a few seconds for the round trip. Your plots should look something like those shown below. Introduction Charts 10.5 seconds 9 metres 1 Position Velocity Acceleration 0 00 ma can Record Playback 4. Take a screenshot of your graphs and copy it in your report. 5. Determine from the Position vs. Time graph the instant of time when the man is farthest away from his initial position (around 6 m). 6. Determine from the Velocity vs. Time plot the velocity the man has when he reached the maximum distance from his initial position. 7. Analyze how his velocity changes afterwards. Explain your answers by using definitions/formulas/laws/principles studied in module 2. 8. Click Reset All.Acceleration is the rate of change of the velocity, so it is the slope of the Velocity vs. Time graph. a V -Vi t- ti 9. Because it is difficult to drag the person in a consistent and reproducible way, set up the initial values for position, velocity and acceleration as follows: x =-10.0 m. v = 0.0 m/s a = 1.0 m/s 10. Click the Play button and let the simulation run roughly 6.3 simulation seconds before pressing the Pause button. Use the zoom buttons to adjust the graphs so they fit in the screen.11. Use the Playback and Slow buttons to find from the Position vs. Time graph the instant of time when the man is passing by the house (approximately 8 m to the right of the origin).12. Find from the Velocity vs. Time graph the velocity and acceleration when the man is passing by the house. 13. Click Reset All. Part C Investigate how the time the man needs to reach the house depends on his acceleration when he starts from rest. 14. Set up new initial values for position, velocity and acceleration as follows: x =-10.0 m. v = 0.0 m/s a = 0.5 m/s 15. Click the Play button and let the simulation run until the man passes by the house, then press the Pause button. 16. Use the Playback and Slow buttons to find from the graphs the instant of time when the man is passing by the house (approximate 8 m to the right of the origin) and his velocity. 17. Repeat points 14, 15 and 16 for the same initial position and velocity but with three different accelerations: 1.5 m/s?, 2.0 m/s and 2.5 m/s'. Summarize your data in Table 1.18. Explain your results by using definitions/formulas/laws/principlesInclude a screenshot of your graphs for the motion of the man you dragged for Part A, as described in the protocol. The graphs should properly fit their spaces. /6 Find from the Position vs. Time the instant of time when the man is farthest away from his initial position (around 6 m) and his velocity from the Velocity vs. Time graph. Note/show/indicate on both plots the point(s) you used to answer this question. /6 How does the man's velocity change after reaching the maximum value for position? Explain your answers by using data from the graphs. Include in your answer the appropriate definitions/formulas/laws/principles studied in module 2. /2Include the graphs you obtained by setting the initial values for position, velocity and acceleration at /6 x =-10.0 m. v = 0.0 m/s a = 1.0 m/s2 Determine from the graphs the time and the man's velocity when the man is passing by the house (approximate 8 m to the right of the origin). /4 Use the formula for the position of an object in accelerated motion studied in module 2 and the acceleration you set up to calculate the instant of time when the man passes by the house. Include all the variable you need for this calculation (symbol, numerical value, unit] 17 Compare your calculation result with the time determined in question 5 and discuss possible discrepancies. /4List your readings for time the man needs to reach the house and his velocity for different accelerations. /8 Acceleration (m/s?) Time (S) Velocity (m/s) 0.5 1.5 2.0 2.5 Explain your results by using definitions/formulas/laws/principles studied in module 2. /4 Describe each graph in words. How does the dependent variable in each graph depend on time? Include the arguments backing up your conclusion. /6 Quantity Characteristics of the quantity: zero/positiveegative/changes its sign; constant/increases/decreases in time (how: linearly onlinearly) position velocity acceleration
Step by Step Solution
There are 3 Steps involved in it

Get step-by-step solutions from verified subject matter experts