

Question: 35. The above figure shows four different markets with changes in either the supply curve or the demand curve. Assuming coffee and tea are
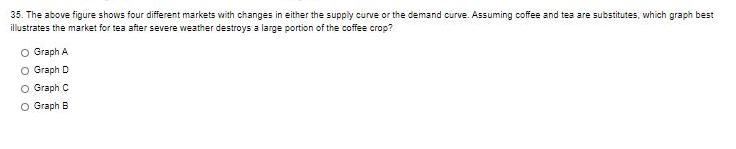
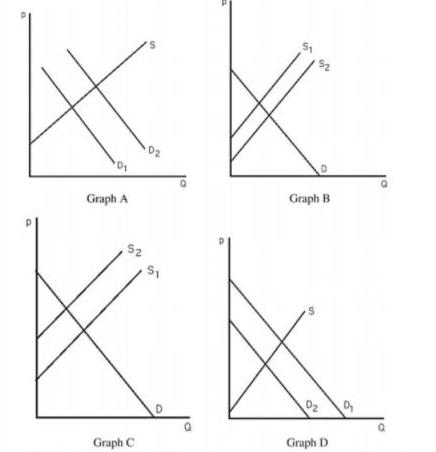
35. The above figure shows four different markets with changes in either the supply curve or the demand curve. Assuming coffee and tea are substitutes, which graph best illustrates the market for tea after severe weather destroys a large portion of the coffee crop? O Graph A. O Graph D O Graph C O Graph B D2 Graph B Graph A 52 Graph D Graph C
Step by Step Solution
★★★★★
3.38 Rating (167 Votes )
There are 3 Steps involved in it
1 Expert Approved Answer
Step: 1 Unlock

Answer graph a demand for tea will increase demand curve will shift rightward Explanation As the ... View full answer
Question Has Been Solved by an Expert!
Get step-by-step solutions from verified subject matter experts
Step: 2 Unlock
Step: 3 Unlock