

Question: 34. The above figure shows four different markets with changes in either the supply curve or the demand curve. Which graph best illustrates the
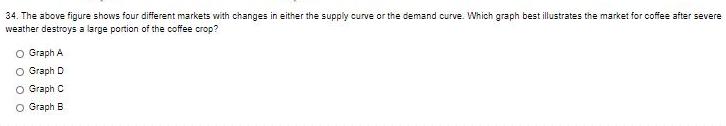
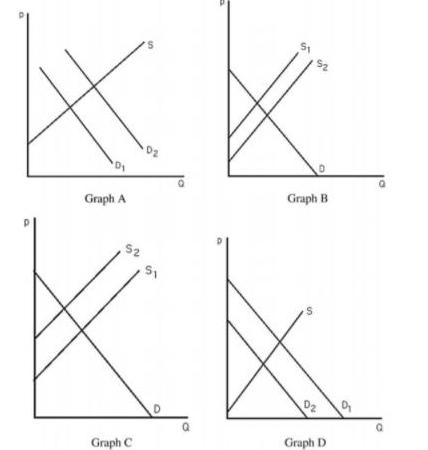
34. The above figure shows four different markets with changes in either the supply curve or the demand curve. Which graph best illustrates the market for coffee after severe weather destroys a large portion of the coffee crop? O Graph A. O Graph D O Graph C O Graph B 02 Graph B Graph A S2 D2 02 Graph D Graph C
Step by Step Solution
★★★★★
3.46 Rating (149 Votes )
There are 3 Steps involved in it
1 Expert Approved Answer
Step: 1 Unlock

Option 3 is correct Graph C explanation Due to w... View full answer
Question Has Been Solved by an Expert!
Get step-by-step solutions from verified subject matter experts
Step: 2 Unlock
Step: 3 Unlock