Question: graph and spreadsheet analysis in Excel. It is helpful to summarize what you have done so far in exercises 1 and 2 by writing a
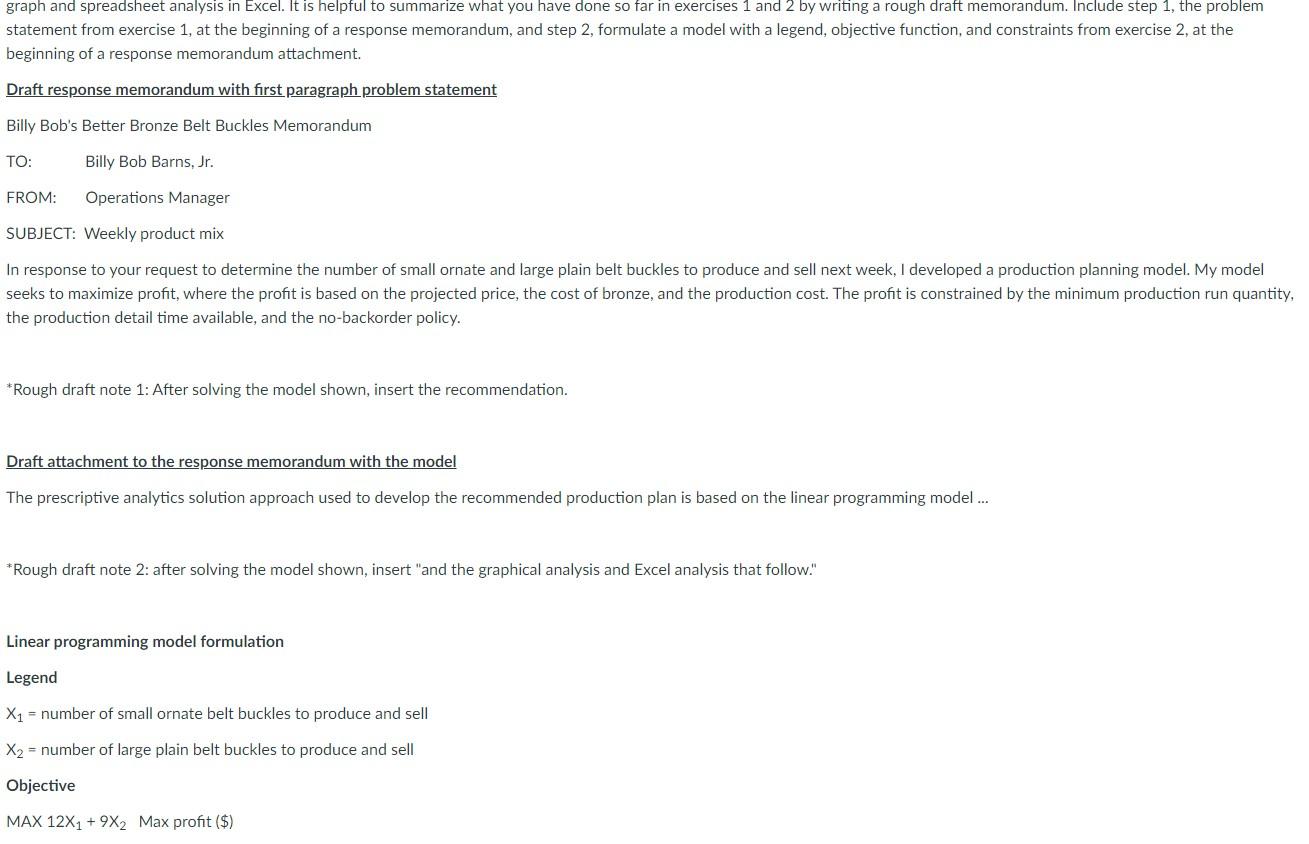
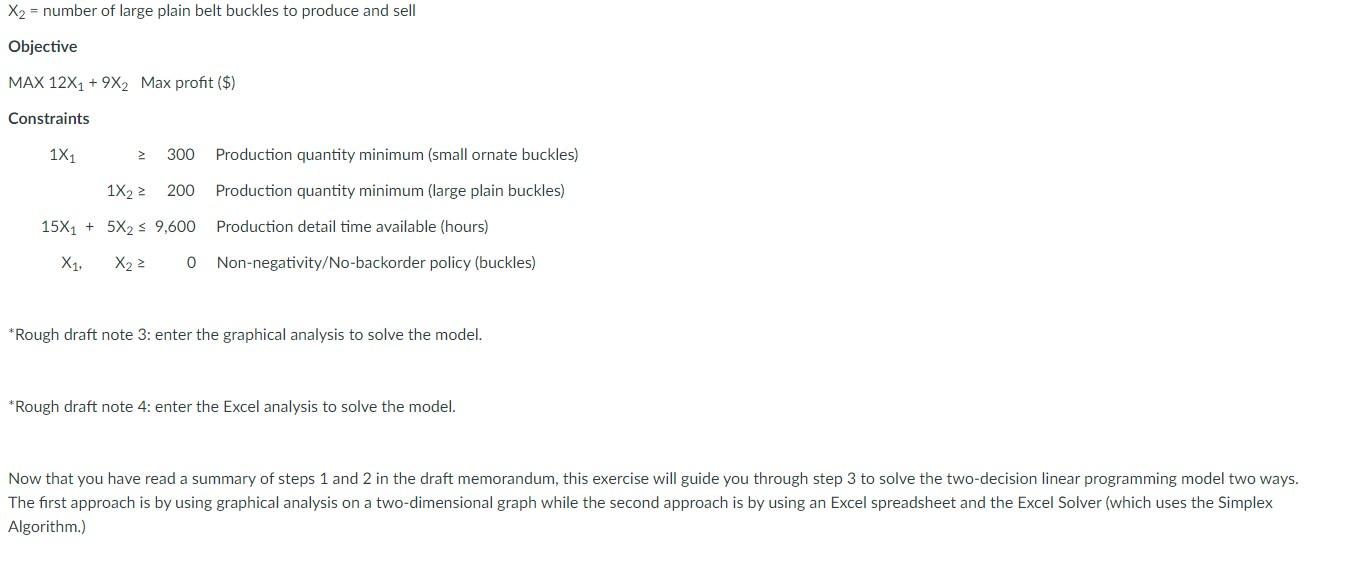
graph and spreadsheet analysis in Excel. It is helpful to summarize what you have done so far in exercises 1 and 2 by writing a rough draft memorandum. Include step 1, the problem statement from exercise 1, at the beginning of a response memorandum, and step 2, formulate a model with a legend, objective function, and constraints from exercise 2, at the beginning of a response memorandum attachment. Draft response memorandum with first paragraph problem statement Billy Bob's Better Bronze Belt Buckles Memorandum TO: Billy Bob Barns, Jr. FROM: Operations Manager SUBJECT: Weekly product mix In response to your request to determine the number of small ornate and large plain belt buckles to produce and sell next week, I developed a production planning model. My model seeks to maximize profit, where the profit is based on the projected price, the cost of bronze, and the production cost. The profit is constrained by the minimum production run quantity, the production detail time available, and the no-backorder policy. *Rough draft note 1: After solving the model shown, insert the recommendation. Draft attachment the response memorandum with the model The prescriptive analytics solution approach used to develop the recommended production plan is based on the linear programming model... * Rough draft note 2: after solving the model shown, insert "and the graphical analysis and Excel analysis that follow." Linear programming model formulation Legend X1 = number of small ornate belt buckles to produce and sell X2 = number of large plain belt buckles to produce and sell Objective MAX 12X1 + 9X2 Max profit ($) X2 = number of large plain belt buckles to produce and sell Objective MAX 12X1 + 9X2 Max profit ($) Constraints 1X1 > 300 Production quantity minimum (small ornate buckles) 1X22 200 Production quantity minimum (large plain buckles) 15X1 + 5X25 9,600 Production detail time available (hours) X1, X22 0 Non-negativity/No-backorder policy (buckles) * Rough draft note 3: enter the graphical analysis to solve the model. * Rough draft note 4: enter the Excel analysis to solve the model. Now that you have read a summary of steps 1 and 2 in the draft memorandum, this exercise will guide you through step 3 to solve the two-decision linear programming model two ways. The first approach is by using graphical analysis on a two-dimensional graph while the second approach is by using an Excel spreadsheet and the Excel Solver (which uses the Simplex Algorithm.)


