

Question: graph does not beed to be answered Excel Online Structured Activity: Bond valuation An investor has two bonds in her portfolio, Bond C and Bond
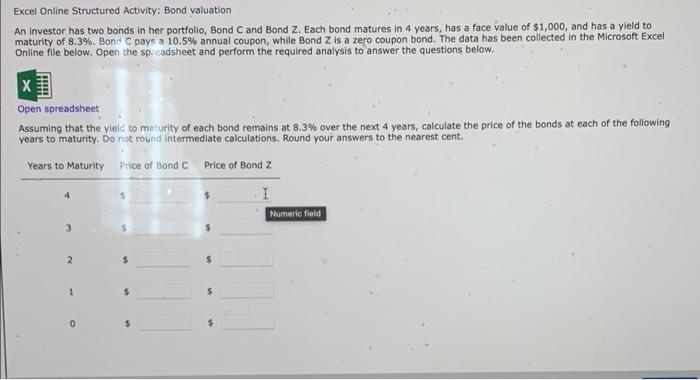
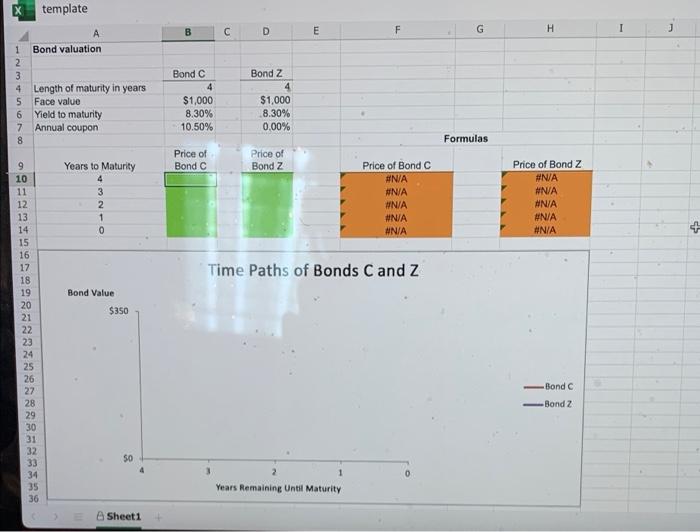
Excel Online Structured Activity: Bond valuation An investor has two bonds in her portfolio, Bond C and Bond Z. Each bond matures in 4 years, has a face value of $1,000, and has a yield to maturity of 8.3%. Bond C pays a 10.5% annual coupon, while Bond Z is a zero coupon bond. The data has been collected in the Microsoft Excel Online file below. Open the sp:eadsheet and perform the required analysis to answer the questions below. X Open spreadsheet Assuming that the yield to maturity of each bond remains at 8.3% over the next 4 years, calculate the price of the bonds at each of the following years to maturity. Do not round Intermediate calculations. Round your answers to the nearest cent. Years to Maturity Price of Bond C Price of Bond z Numeric field 3 2 $ $ 1 $ 0 $ template D E F G H I 00 VAN A 1 Bond valuation 2 3 4 Length of maturity in years 5 Face value 6 Yield to maturity 7 Annual coupon 8 Bond C 4 $1,000 8.30% 10.50% Bond Z 4 $1,000 8.30% 0.00% Formulas Price of Bond C Price of Bond Z Years to Maturity 4 3 2 1 0 Price of Bond C #N/A #N/A #N/A #N/A #N/A Price of Bond Z #N/A WNA #N/A #N/A #N/A Time Paths of Bonds C and Z 9 10 11 12 13 14 15 16 17 18 19 20 21 22 23 24 25 26 27 28 Bond Value $350 qwnag5BnBB%82mm Bond Bond Z 50 30 31 32 33 34 35 36 4 Years Remaining Until Maturity Sheet1
Step by Step Solution
There are 3 Steps involved in it

Get step-by-step solutions from verified subject matter experts