

Question: Graph each distribution using a probability histogram. a) X P(x) b) X P(x) 0 0.05 12 0.13 5 0.24 12 0.38 2 10 0.12 O
Graph each distribution using a probability
histogram.
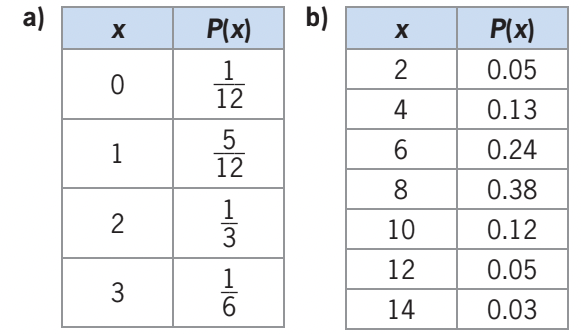
a) X P(x) b) X P(x) 0 0.05 12 0.13 5 0.24 12 0.38 2 10 0.12 O / H W / H 12 0.05 14 0.03
Step by Step Solution
There are 3 Steps involved in it
1 Expert Approved Answer
Step: 1 Unlock

Question Has Been Solved by an Expert!
Get step-by-step solutions from verified subject matter experts
Step: 2 Unlock
Step: 3 Unlock