

Question: Graph each question separately. Make sure to start with the initial Supply (S1) and Demand (D1) curves and its corresponding equilibrium price (P1) and
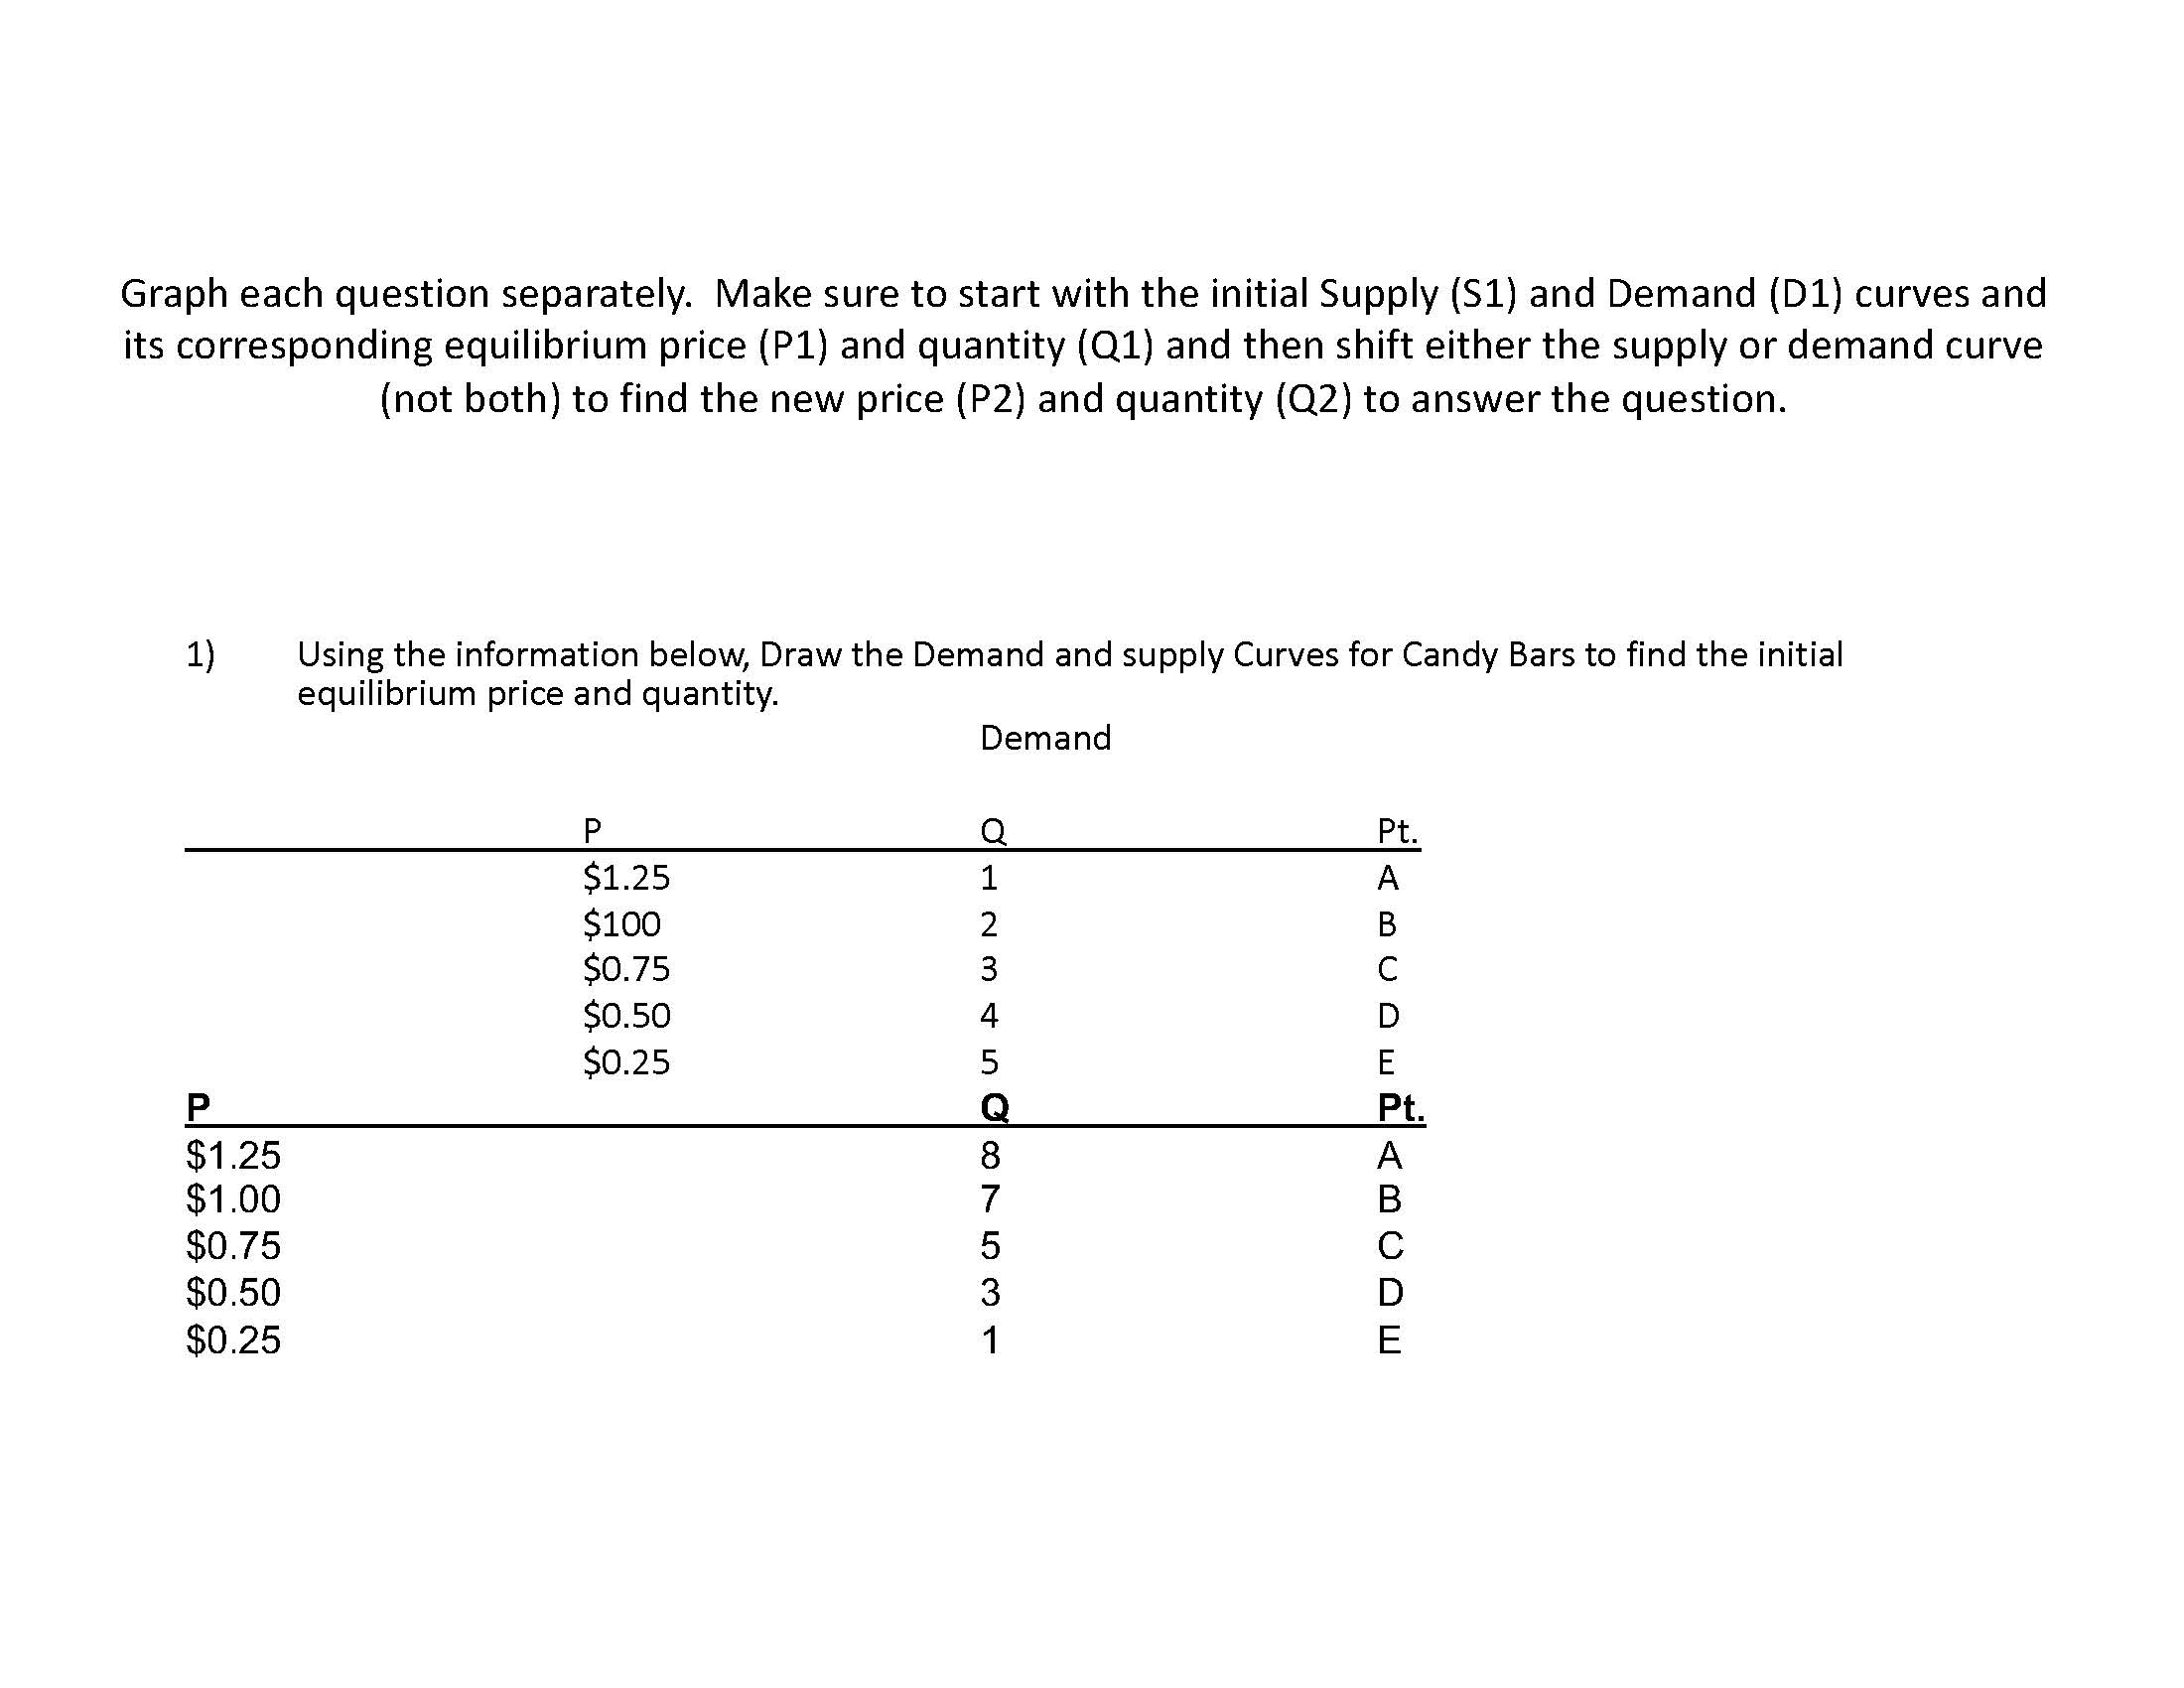
Graph each question separately. Make sure to start with the initial Supply (S1) and Demand (D1) curves and its corresponding equilibrium price (P1) and quantity (Q1) and then shift either the supply or demand curve (not both) to find the new price (P2) and quantity (Q2) to answer the question. 1) Using the information below, Draw the Demand and supply Curves for Candy Bars to find the initial equilibrium price and quantity. P $1.25 $100 $0.75 $0.50 $0.25 P $1.25 $1.00 $0.75 $0.50 $0.25 Demand Q Pt. A B CDE PABCDE Q Pt. 1234587531 Now use a new graph for each question below to show what happens to the equilibrium price and quantity for each of the following events. Make sure to include the initial supply (S1) and demand (D1) curves with their corresponding initial equilibrium price (P1) and Quantity (Q1) and then shift the Supply (S2) or Demand (D2) curve (not both) with the change in the Price (P2) and the Quantity (Q2). DRAW A NEW GRAPH FOR EACH QUESTION. The following questions/graphs should be in general terms, S1, S2, D1, D2, P1, P2, Q1, Q2. Thus the graphs do not need actual numbers, similar to the PowerPoint lectures. Email me if you any have questions. NOTE: This is what the midterm exam questions will be like and the graphs are worth the points. 2) candy stops heart disease 3) the price of chocolate increases 4) Tech. advances in how candy is made 5) we tax candy.
Step by Step Solution
There are 3 Steps involved in it

Get step-by-step solutions from verified subject matter experts