

Question: Graph Input Tool 40 Market for Gin 36 Supply Quantity 48 32 (Bottles) PRICE (Dollars per bottle) Demand Price Supply Price 28 (Dollars per bottle)
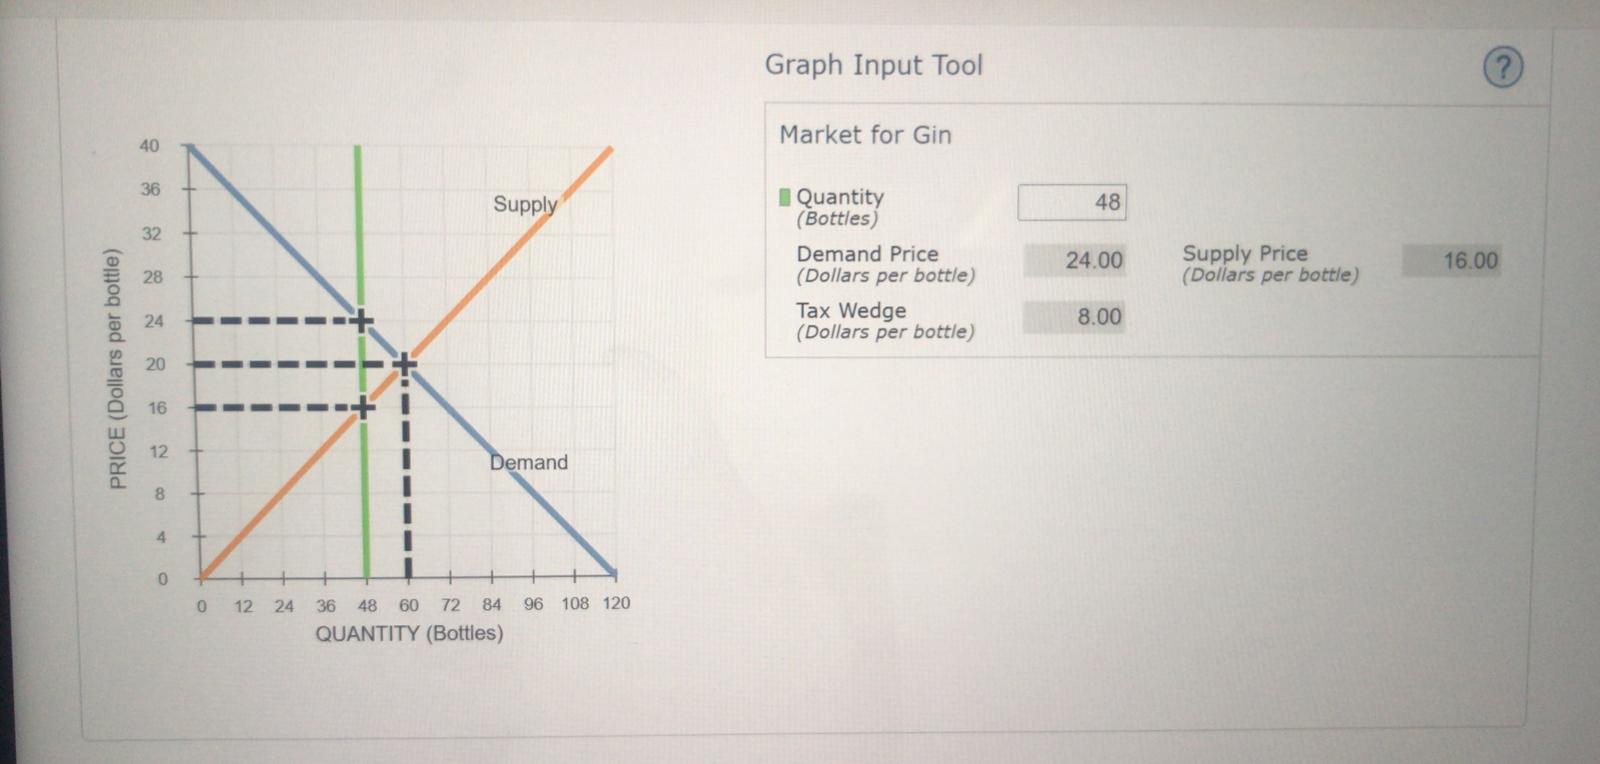
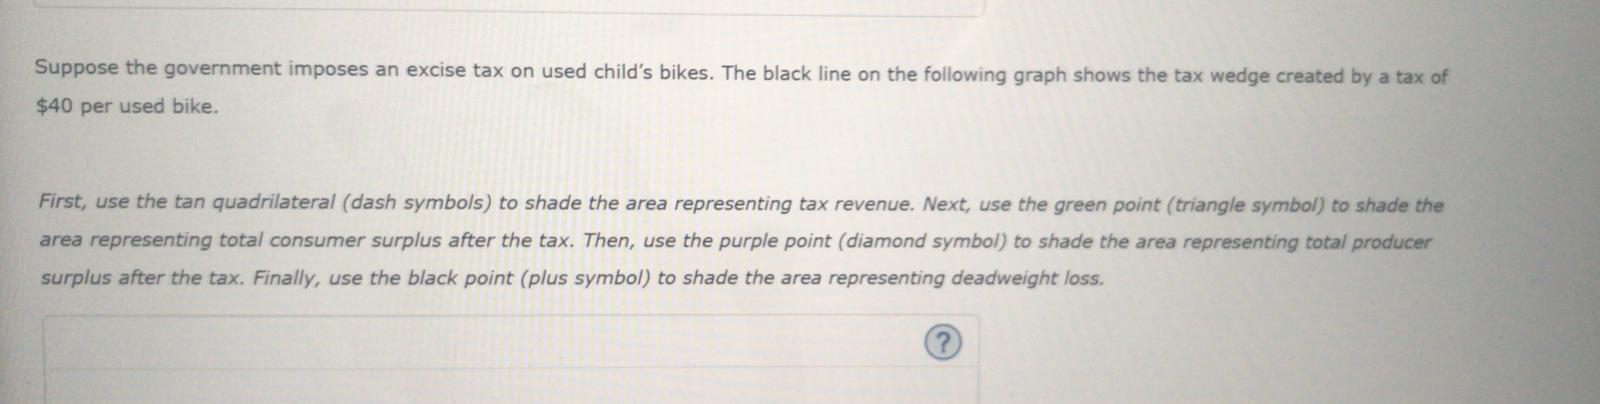
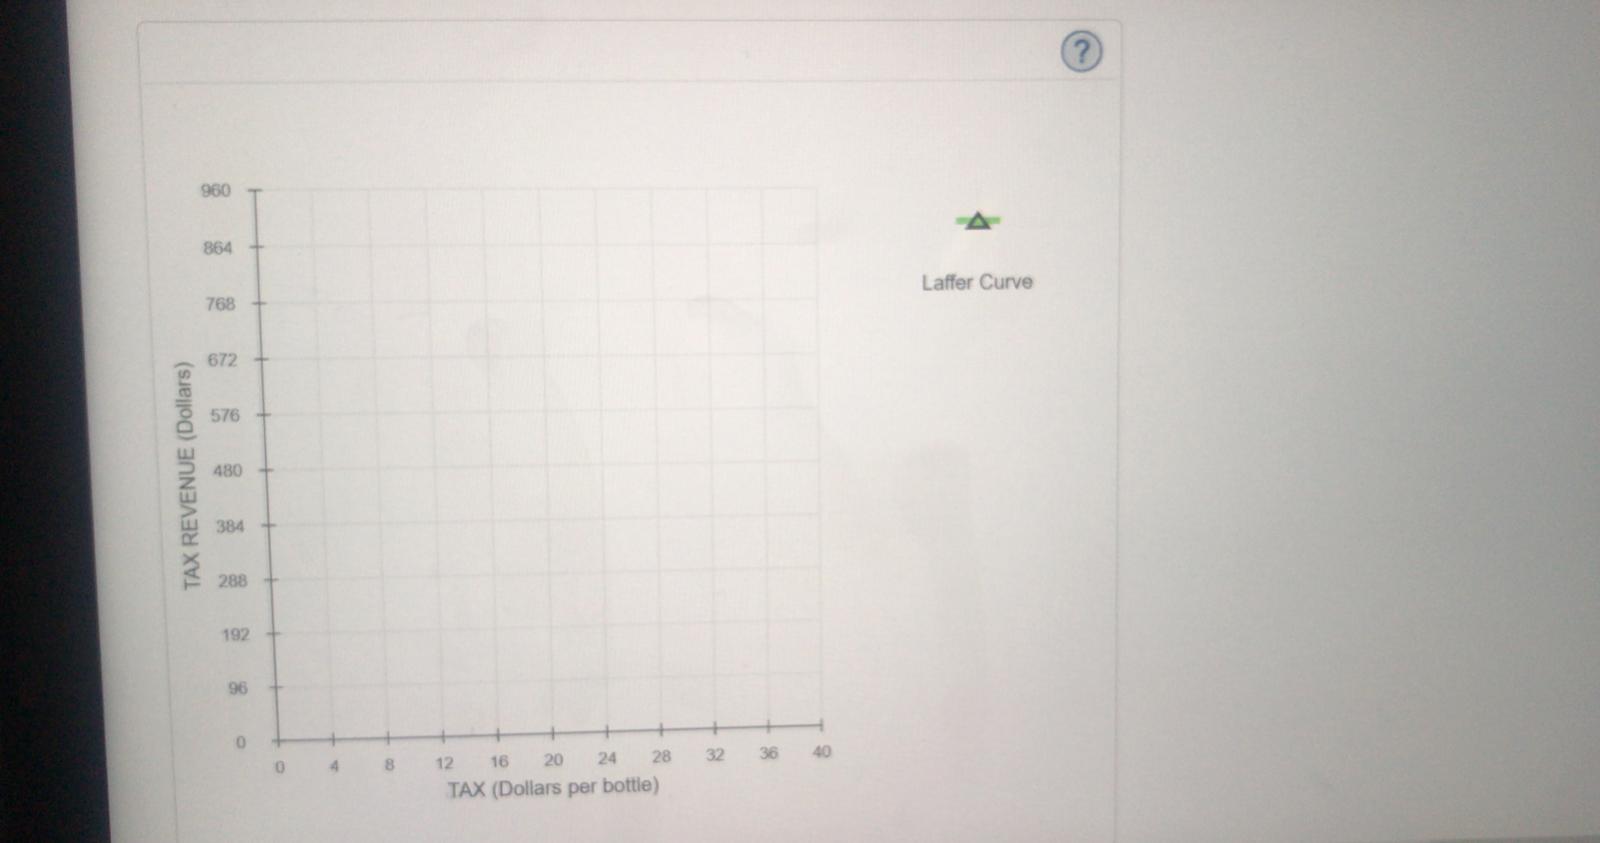
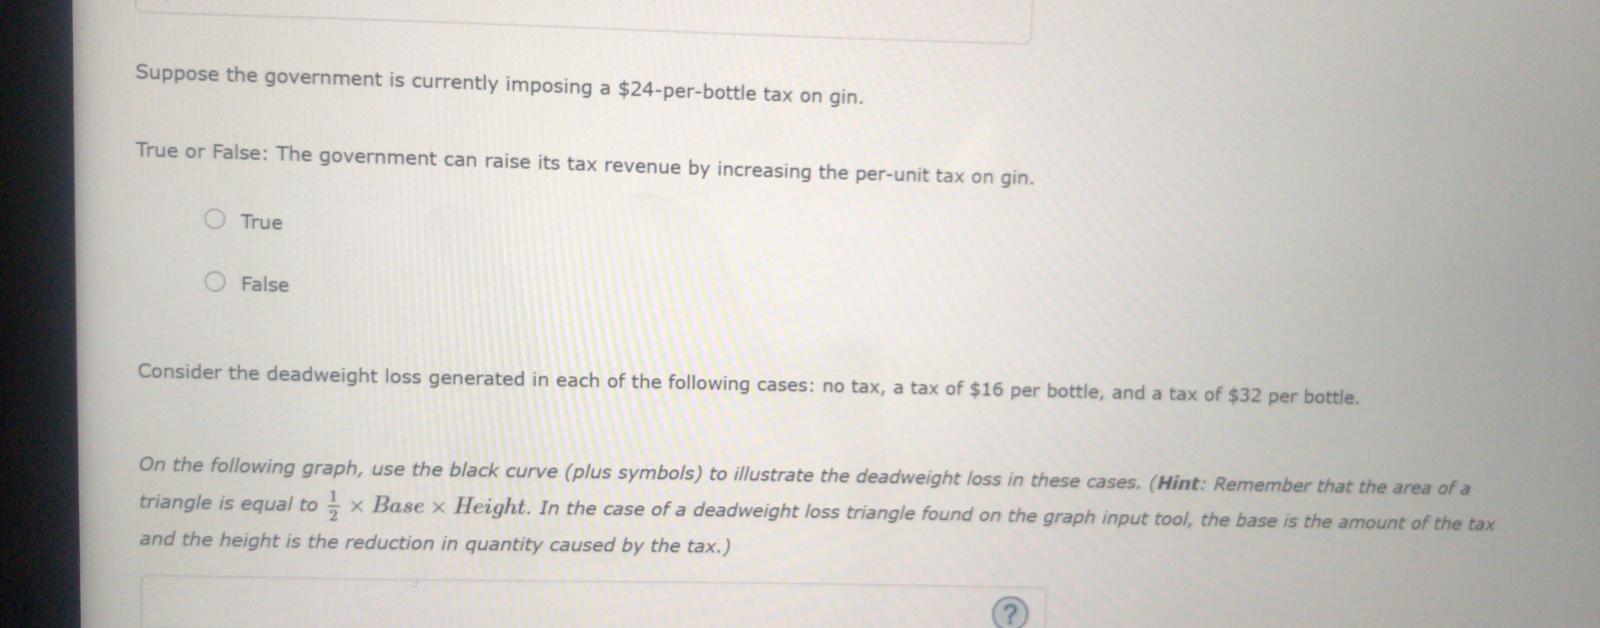
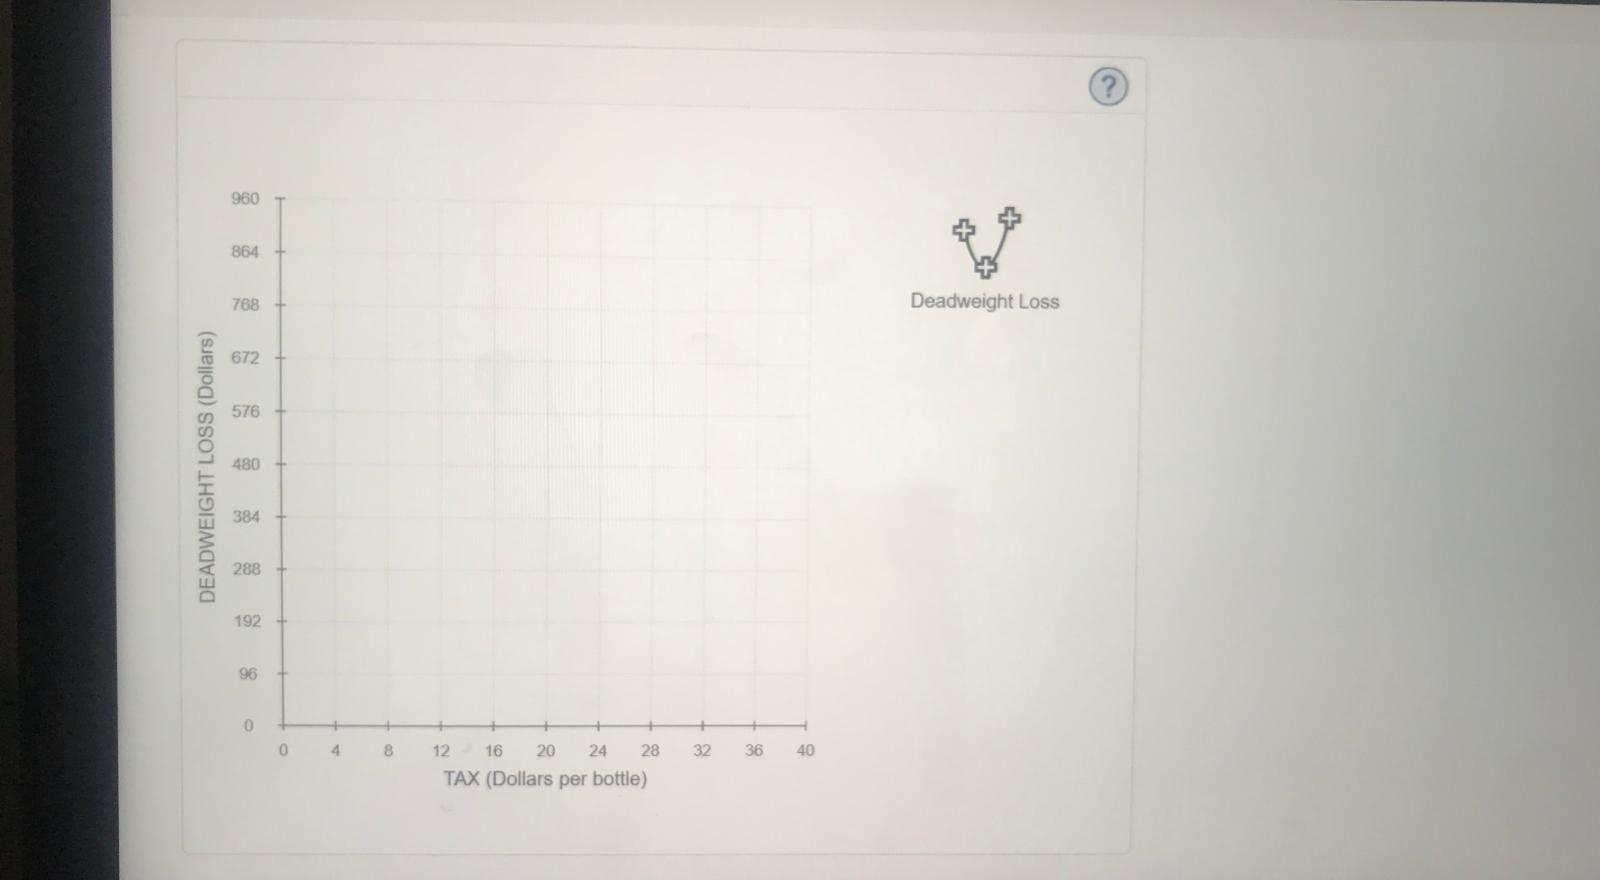
Graph Input Tool 40 Market for Gin 36 Supply Quantity 48 32 (Bottles) PRICE (Dollars per bottle) Demand Price Supply Price 28 (Dollars per bottle) 24.00 (Dollars per bottle) 16.00 24 Tax Wedge (Dollars per bottle) 8.00 20 12 Demand Co O 0 12 24 36 48 60 72 84 96 108 120 QUANTITY (Bottles)Suppose the government imposes an excise tax on used child's bikes. The black line on the following graph shows the tax wedge created by a tax of $40 per used bike. First, use the tan quadrilateral (dash symbols) to shade the area representing tax revenue. Next, use the green point (triangle symbol) to shade the area representing total consumer surplus after the tax. Then, use the purple point (diamond symbol) to shade the area representing total producer surplus after the tax. Finally, use the black point (plus symbol) to shade the area representing deadweight loss.\fSuppose the government is currently imposing a $24-per-bottle tax on gin. True or False: The government can raise its tax revenue by increasing the per-unit tax on gin. O True False Consider the deadweight loss generated in each of the following cases: no tax, a tax of $16 per bottle, and a tax of $32 per bottle. On the following graph, use the black curve (plus symbols) to illustrate the deadweight loss in these cases. (Hint: Remember that the area of a triangle is equal to - x Base x Height. In the case of a deadweight loss triangle found on the graph input tool, the base is the amount of the tax and the height is the reduction in quantity caused by the tax.)\fAttempts: Score: / 5 11. The Laffer curve Governments often place so-called sin taxes on goods or services such as cigarettes and alcohol. These kinds of taxes are popular with politicians because they are usually more palatable to voters than income taxes. To understand the effect of such a tax, consider the monthly market for gin, which is shown on the following graph. Use the graph input tool to help you answer the following questions. You will not be graded on any changes you make to this graph. Note: Once you enter a value in a white field, the graph and any corresponding amounts in each grey field will change accordingly
Step by Step Solution
There are 3 Steps involved in it

Get step-by-step solutions from verified subject matter experts