

Question: Graph of the Constraint Lines Question 1: Graphical Solution LP - (15 POINTS) Consider the following linear program: B Max A+B St. (1) 4A +6B
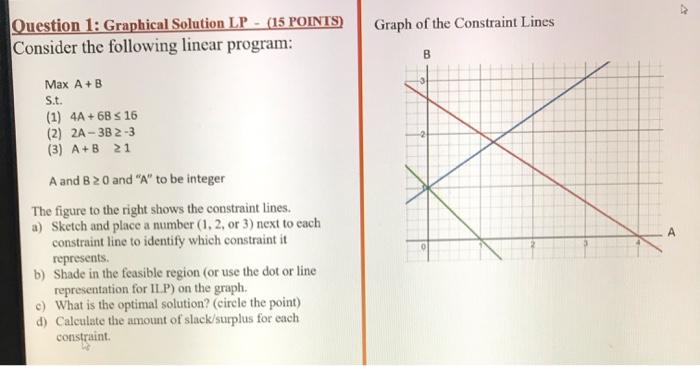
Graph of the Constraint Lines Question 1: Graphical Solution LP - (15 POINTS) Consider the following linear program: B Max A+B St. (1) 4A +6B 16 (2) 2A-3B2-3 (3) A+B 21 A and B 20 and "A" to be integer The figure to the right shows the constraint lines. a) Sketch and place a number (1, 2, or 3) next to each constraint line to identify which constraint it represents. b) Shade in the feasible region (or use the dot or line representation for ILP) on the graph. c) What is the optimal solution? (circle the point) d) Calculate the amount of slack/surplus for each constraint
Step by Step Solution
There are 3 Steps involved in it
1 Expert Approved Answer
Step: 1 Unlock

Question Has Been Solved by an Expert!
Get step-by-step solutions from verified subject matter experts
Step: 2 Unlock
Step: 3 Unlock