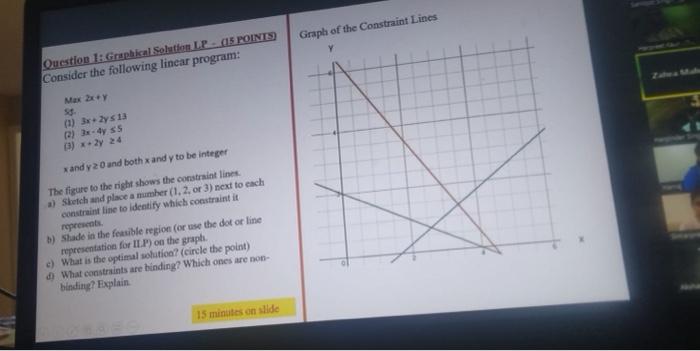
Question: Graph of the Constraint Lines Question 1: Graphical Solution LP (15 POINTS Consider the following linear program: Max 2x+y (1) 3xlysta R) 3-4 ss 3

Graph of the Constraint Lines Question 1:
Graph of the Constraint Lines Question 1: Graphical Solution LP (15 POINTS Consider the following linear program: Max 2x+y (1) 3xlysta R) 3-4 ss 3 - 2 24 and y20 and both x and y to be integer The figure to the right shows the construint lines ) Sketch and place a number (1.2 or 3) next to each constraint line to identify which constraint it represents 1) Shade in the feasible region (or use the dot or line representation for ILP) on the graph. c) What is the optimal solutioa? (circle the point) 4) What constraints are binding? Which ones are non- binding? Explain 15 minutes on silde

Step by Step Solution

There are 3 Steps involved in it

1 Expert Approved Answer
Step: 1 Unlock blur-text-image
Question Has Been Solved by an Expert!

Get step-by-step solutions from verified subject matter experts

Step: 2 Unlock
Step: 3 Unlock

Students Have Also Explored These Related General Management Questions!