

Question: Graph ) Product Quantity Price Quantity year 1 (year 1 Price ( year 2) ( year 2 ) cars 50 25 100 30 Homes 10

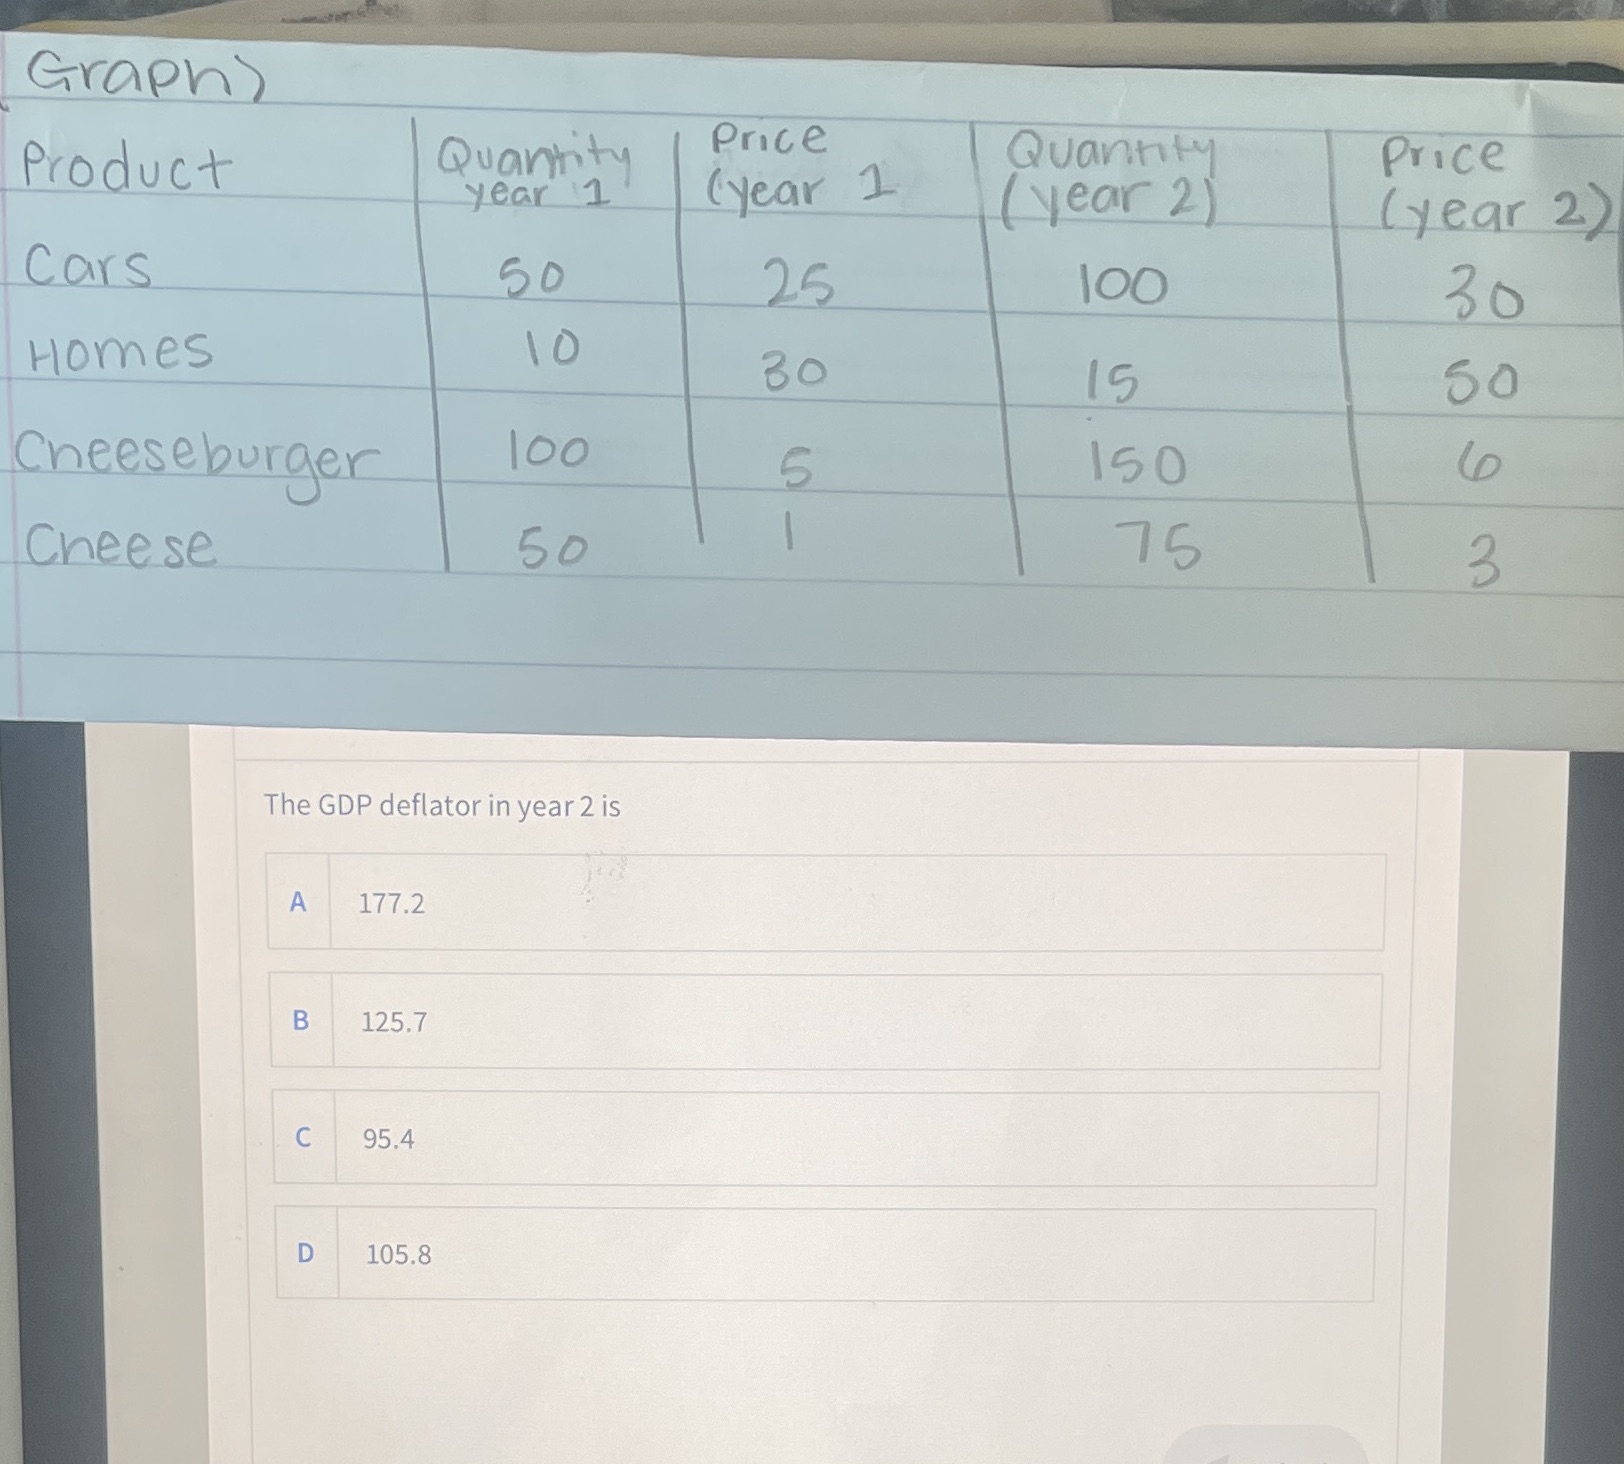
Graph ) Product Quantity Price Quantity year 1 (year 1 Price ( year 2) ( year 2 ) cars 50 25 100 30 Homes 10 30 15 Cheeseburger 100 150 Cheese 50 - 75 3 The GDP deflator in year 2 is A 177.2 B 125.7 C 95.4 D 105.8
Step by Step Solution
There are 3 Steps involved in it
1 Expert Approved Answer
Step: 1 Unlock

Question Has Been Solved by an Expert!
Get step-by-step solutions from verified subject matter experts
Step: 2 Unlock
Step: 3 Unlock