

Question: Graph the curve described by the parametric equation x(t) = 2 cost, y(t) = 2 sint; 0sts 2. Complete the table. t 0 x(t)
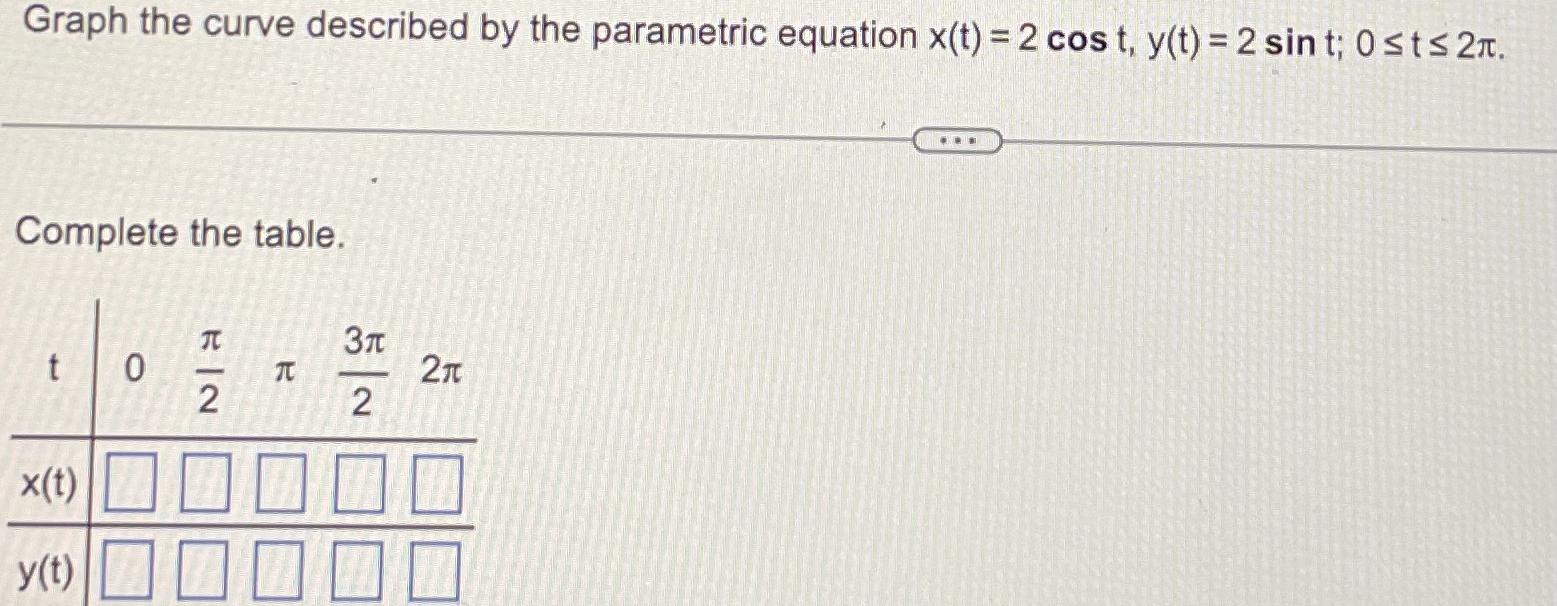
Graph the curve described by the parametric equation x(t) = 2 cost, y(t) = 2 sint; 0sts 2. Complete the table. t 0 x(t) y(t) #2 3 2 2
Step by Step Solution
There are 3 Steps involved in it
1 Expert Approved Answer
Step: 1 Unlock

Question Has Been Solved by an Expert!
Get step-by-step solutions from verified subject matter experts
Step: 2 Unlock
Step: 3 Unlock