

Question: Graph the exponential function g (x) = -4 - 1. To do this, plot two points on the graph of the function, and also draw
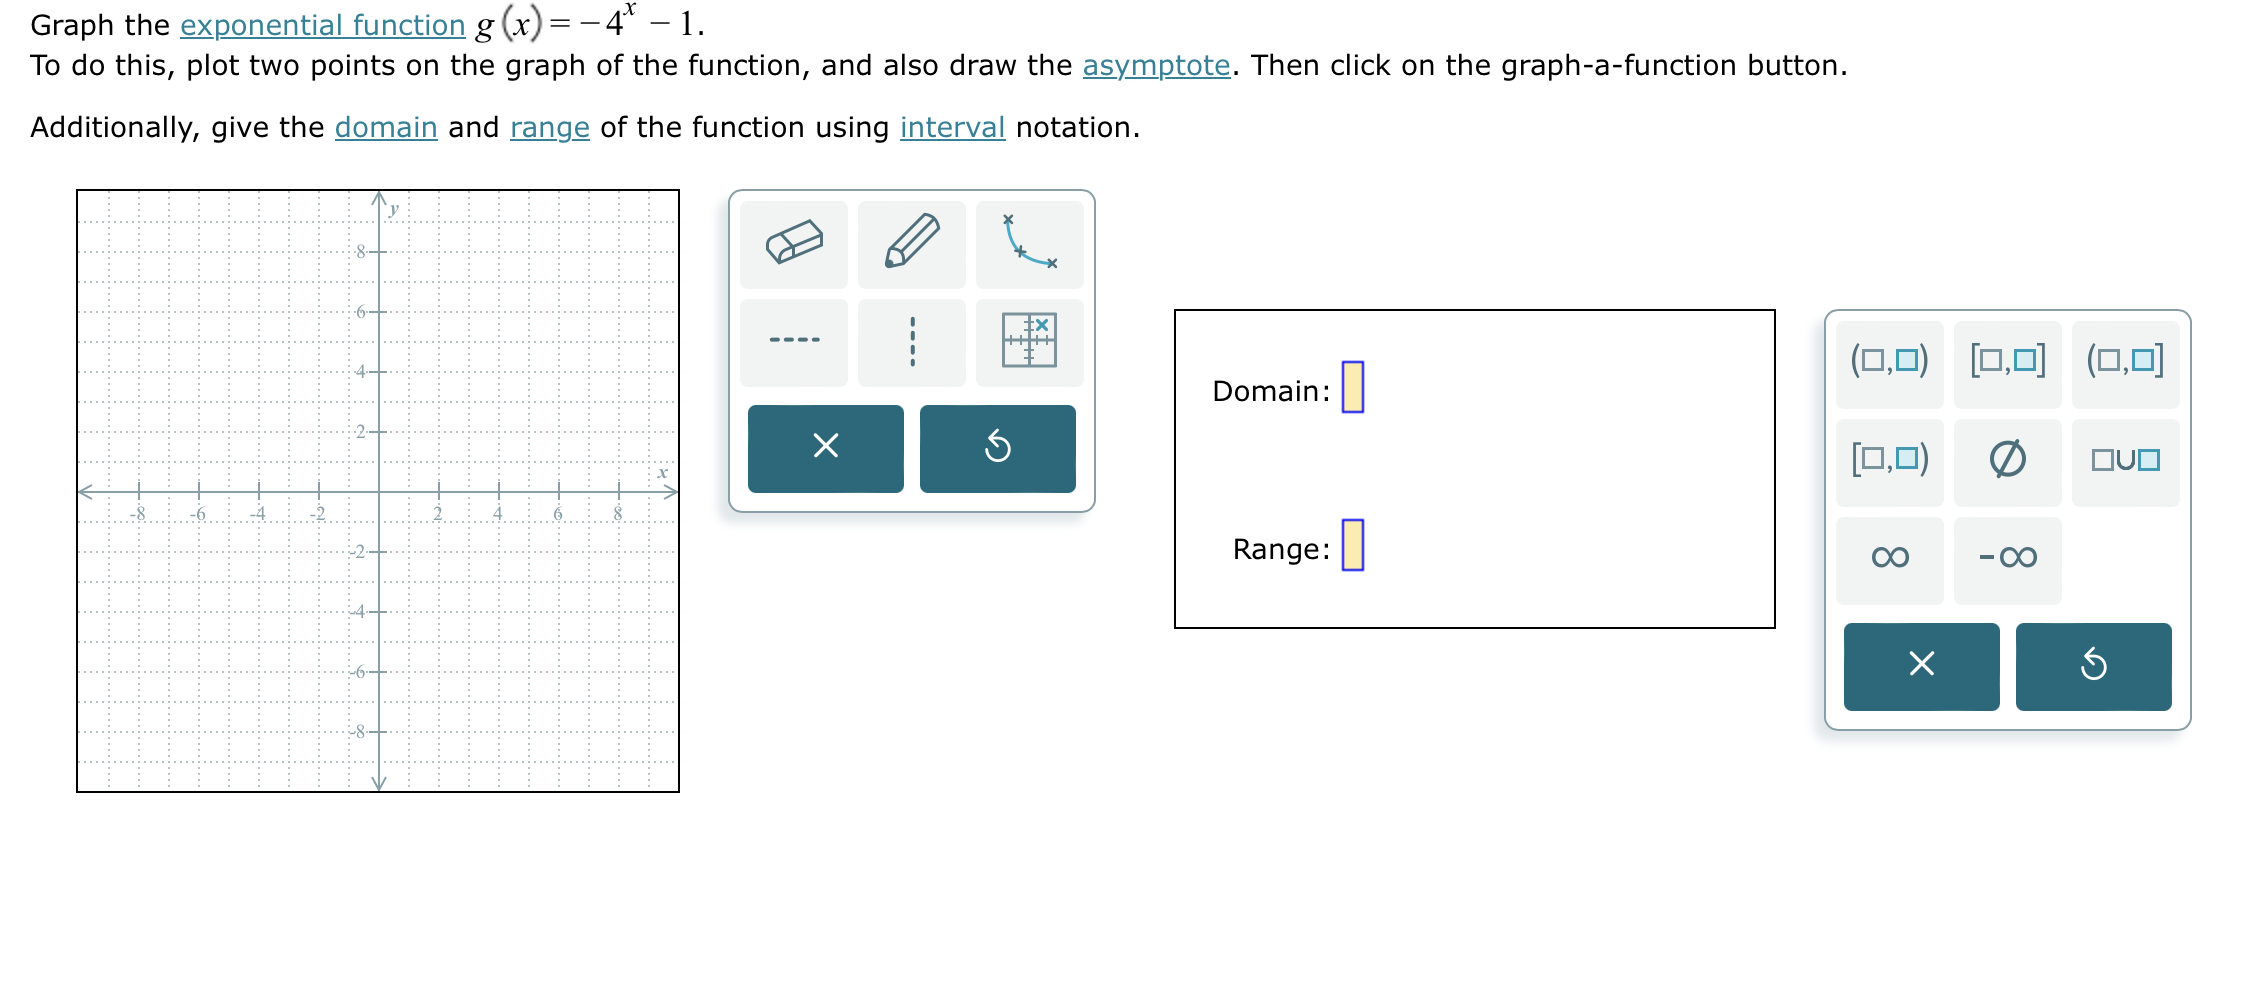
Graph the exponential function g (x) = -4" - 1. To do this, plot two points on the graph of the function, and also draw the asymptote. Then click on the graph-a-function button. Additionally, give the domain and range of the function using interval notation. ....... .... .. ..:.8- . . . . . . ... .. . . . ... . . . . . . . . . . . . . .. . .... ... ....... .... . ... . ...........................;... ........ ....;... Domain: (0,0) [0,0] (0,0] .......... ... ...... ...... ... .. ....;... .. .... ... ....... . .... ?........ ... X . ... ..:... .. ... [0,0) OVO ......6.... .. ... ..... ... . . ...... .. ... . . .. . ... . . .. .. ... ........... ... ... .. 2. .. ....... Range: OO - OO ............. ....;... ....... .......... .......... ... ...... ..4- .......... .... ... ... ..... ...... ...... ...... .. ... ......6- .. .... .... ... X ... .... ..... ... ... ... ... ... ... ..:... ... ....!... .. . . ... .... ..:.... .. ... .. .... ...... .. ...
Step by Step Solution
There are 3 Steps involved in it

Get step-by-step solutions from verified subject matter experts