

Question: Graph the exponential function g (x) = 4 + 3. To do this, plot two points on the graph of the function, and also draw
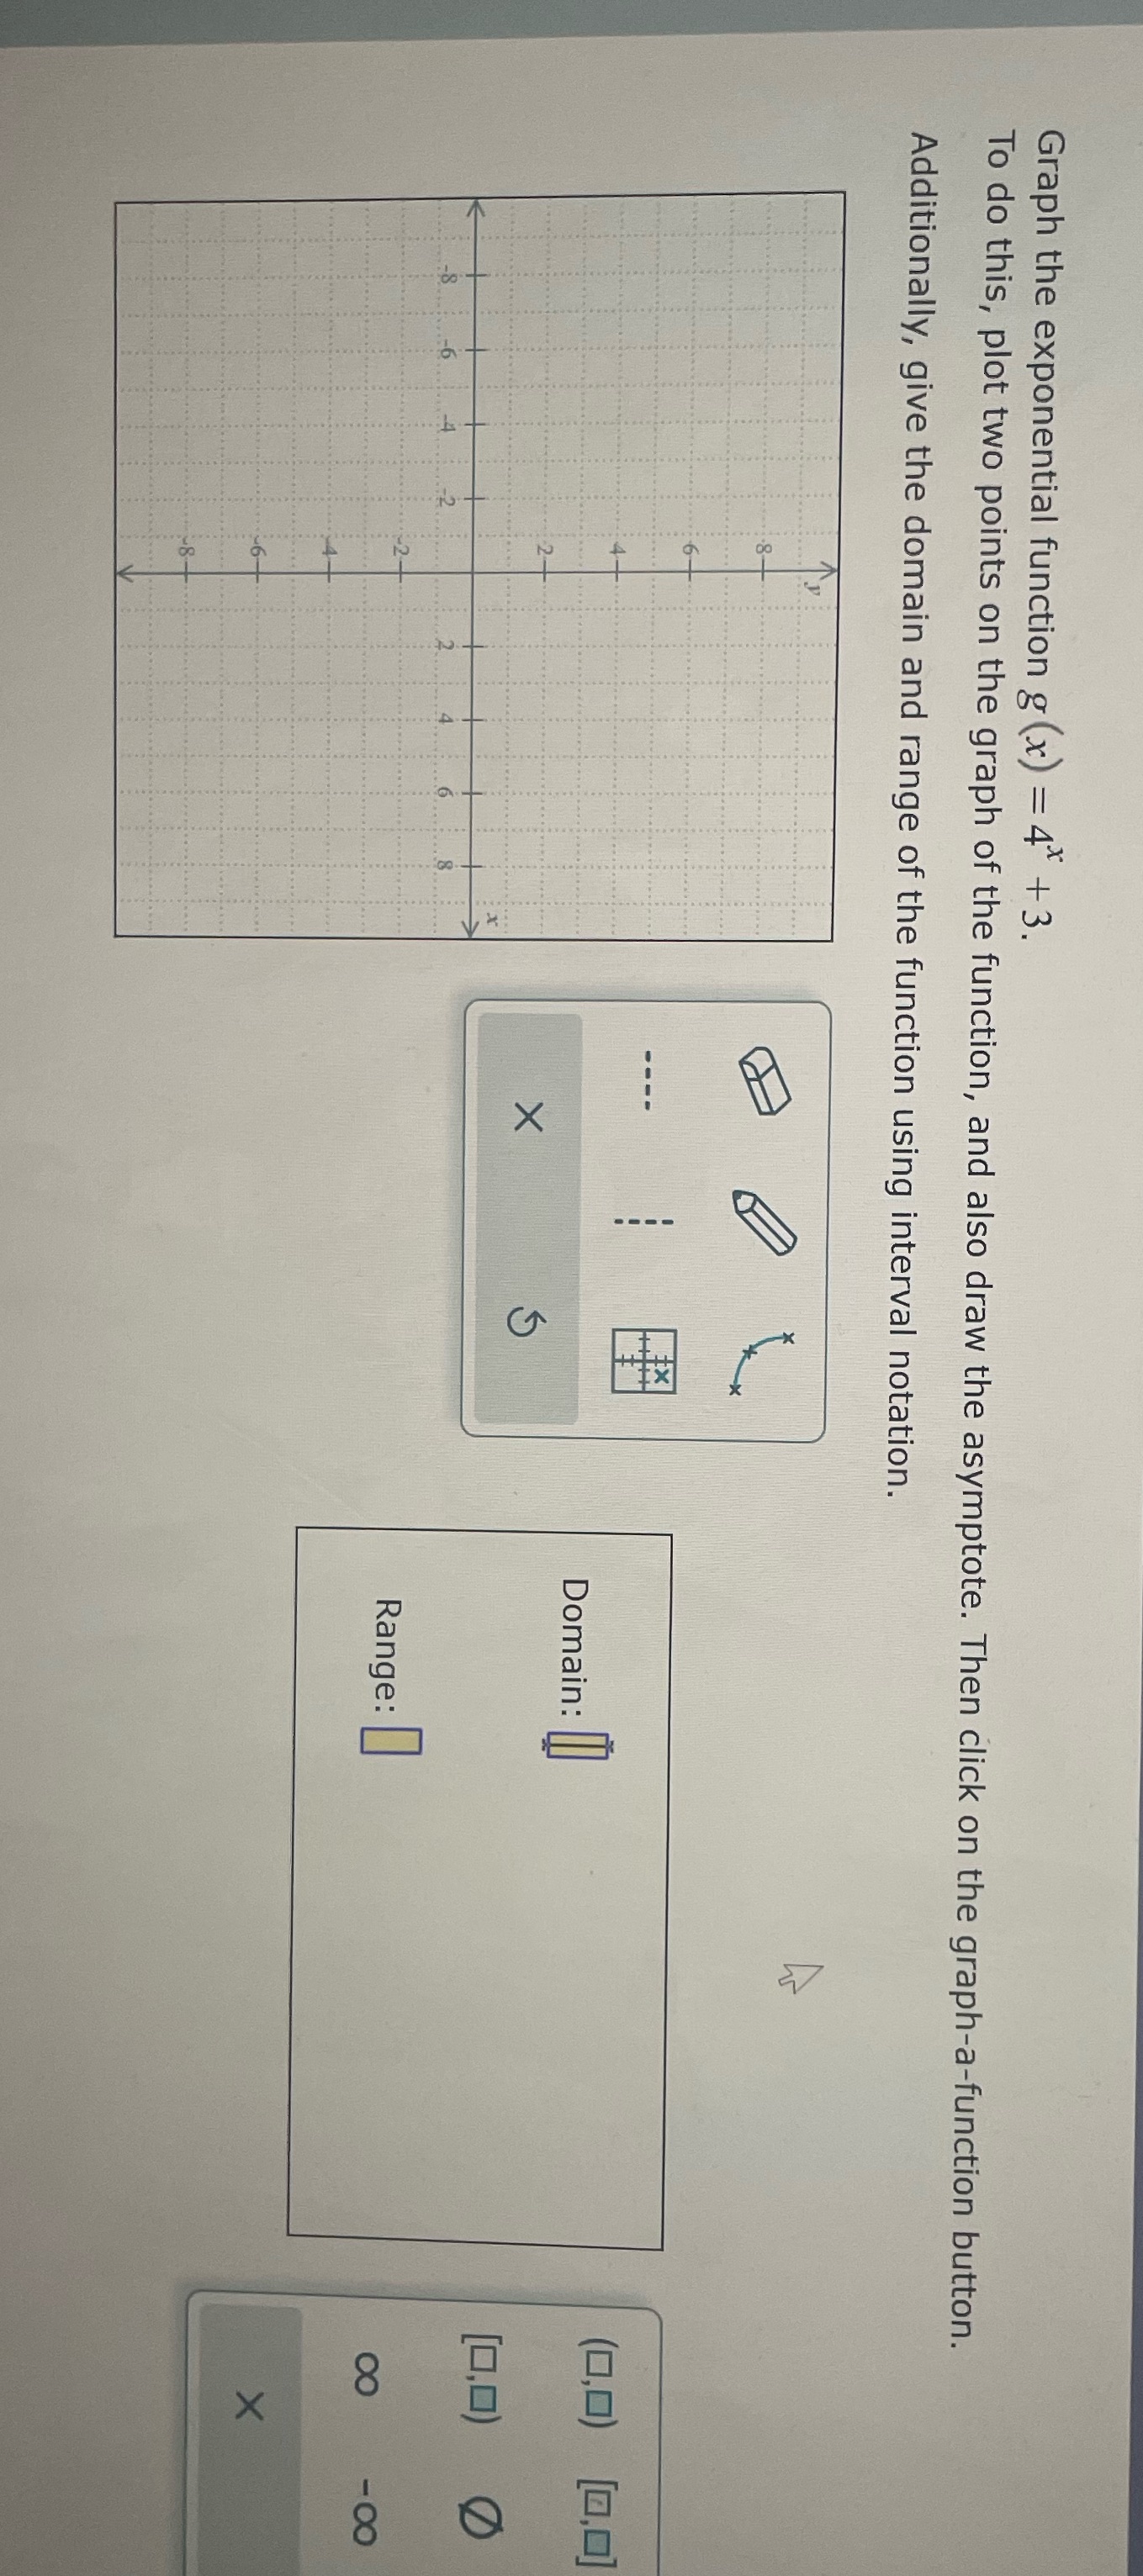
Graph the exponential function g (x) = 4 + 3. To do this, plot two points on the graph of the function, and also draw the asymptote. Then click on the graph-a-function button. Additionally, give the domain and range of the function using interval notation. (0,0) [0,0] Domain: X [0,0) Range: OO X
Step by Step Solution
There are 3 Steps involved in it
1 Expert Approved Answer
Step: 1 Unlock

Question Has Been Solved by an Expert!
Get step-by-step solutions from verified subject matter experts
Step: 2 Unlock
Step: 3 Unlock