

Question: Graph the function and state the amplitude, period and midline. State the maximum and minimum y-values and the corresponding - values on one period
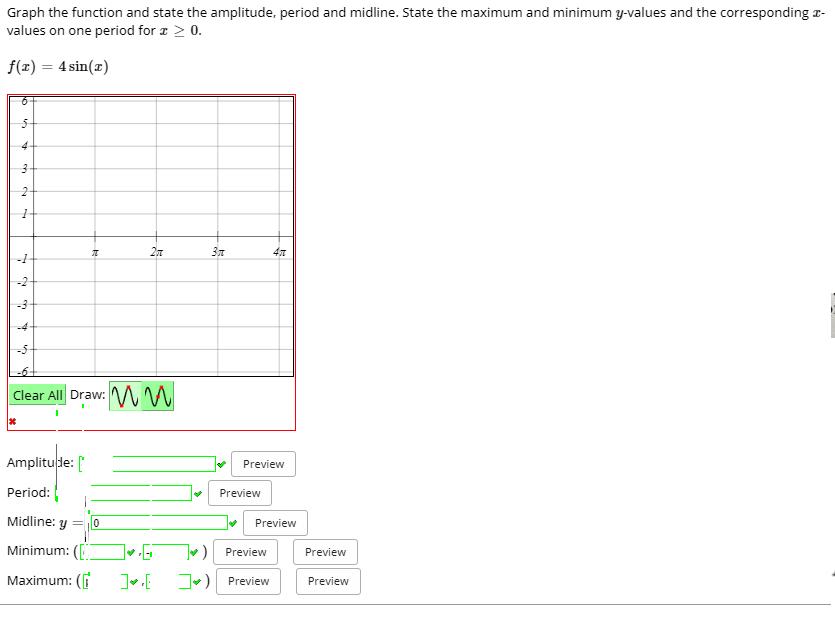
Graph the function and state the amplitude, period and midline. State the maximum and minimum y-values and the corresponding - values on one period for x > 0. f(x) = 4 sin(x) 16 No * 1 2 m to " Clear All Draw: M 2n Amplitude: [ Period: Midline: y 0 Minimum: (D) Maximum: ( 3 Preview 4 Preview 47 Preview ) Preview ][]) Preview Preview Preview
Step by Step Solution
★★★★★
3.42 Rating (142 Votes )
There are 3 Steps involved in it
1 Expert Approved Answer
Step: 1 Unlock

ANSWER This is a basic sine function wit... View full answer
Question Has Been Solved by an Expert!
Get step-by-step solutions from verified subject matter experts
Step: 2 Unlock
Step: 3 Unlock