

Question: Graph the function, not by plotting points, but by starting from the graph of y = ex in the figure below. 9(X) = -ex- 1
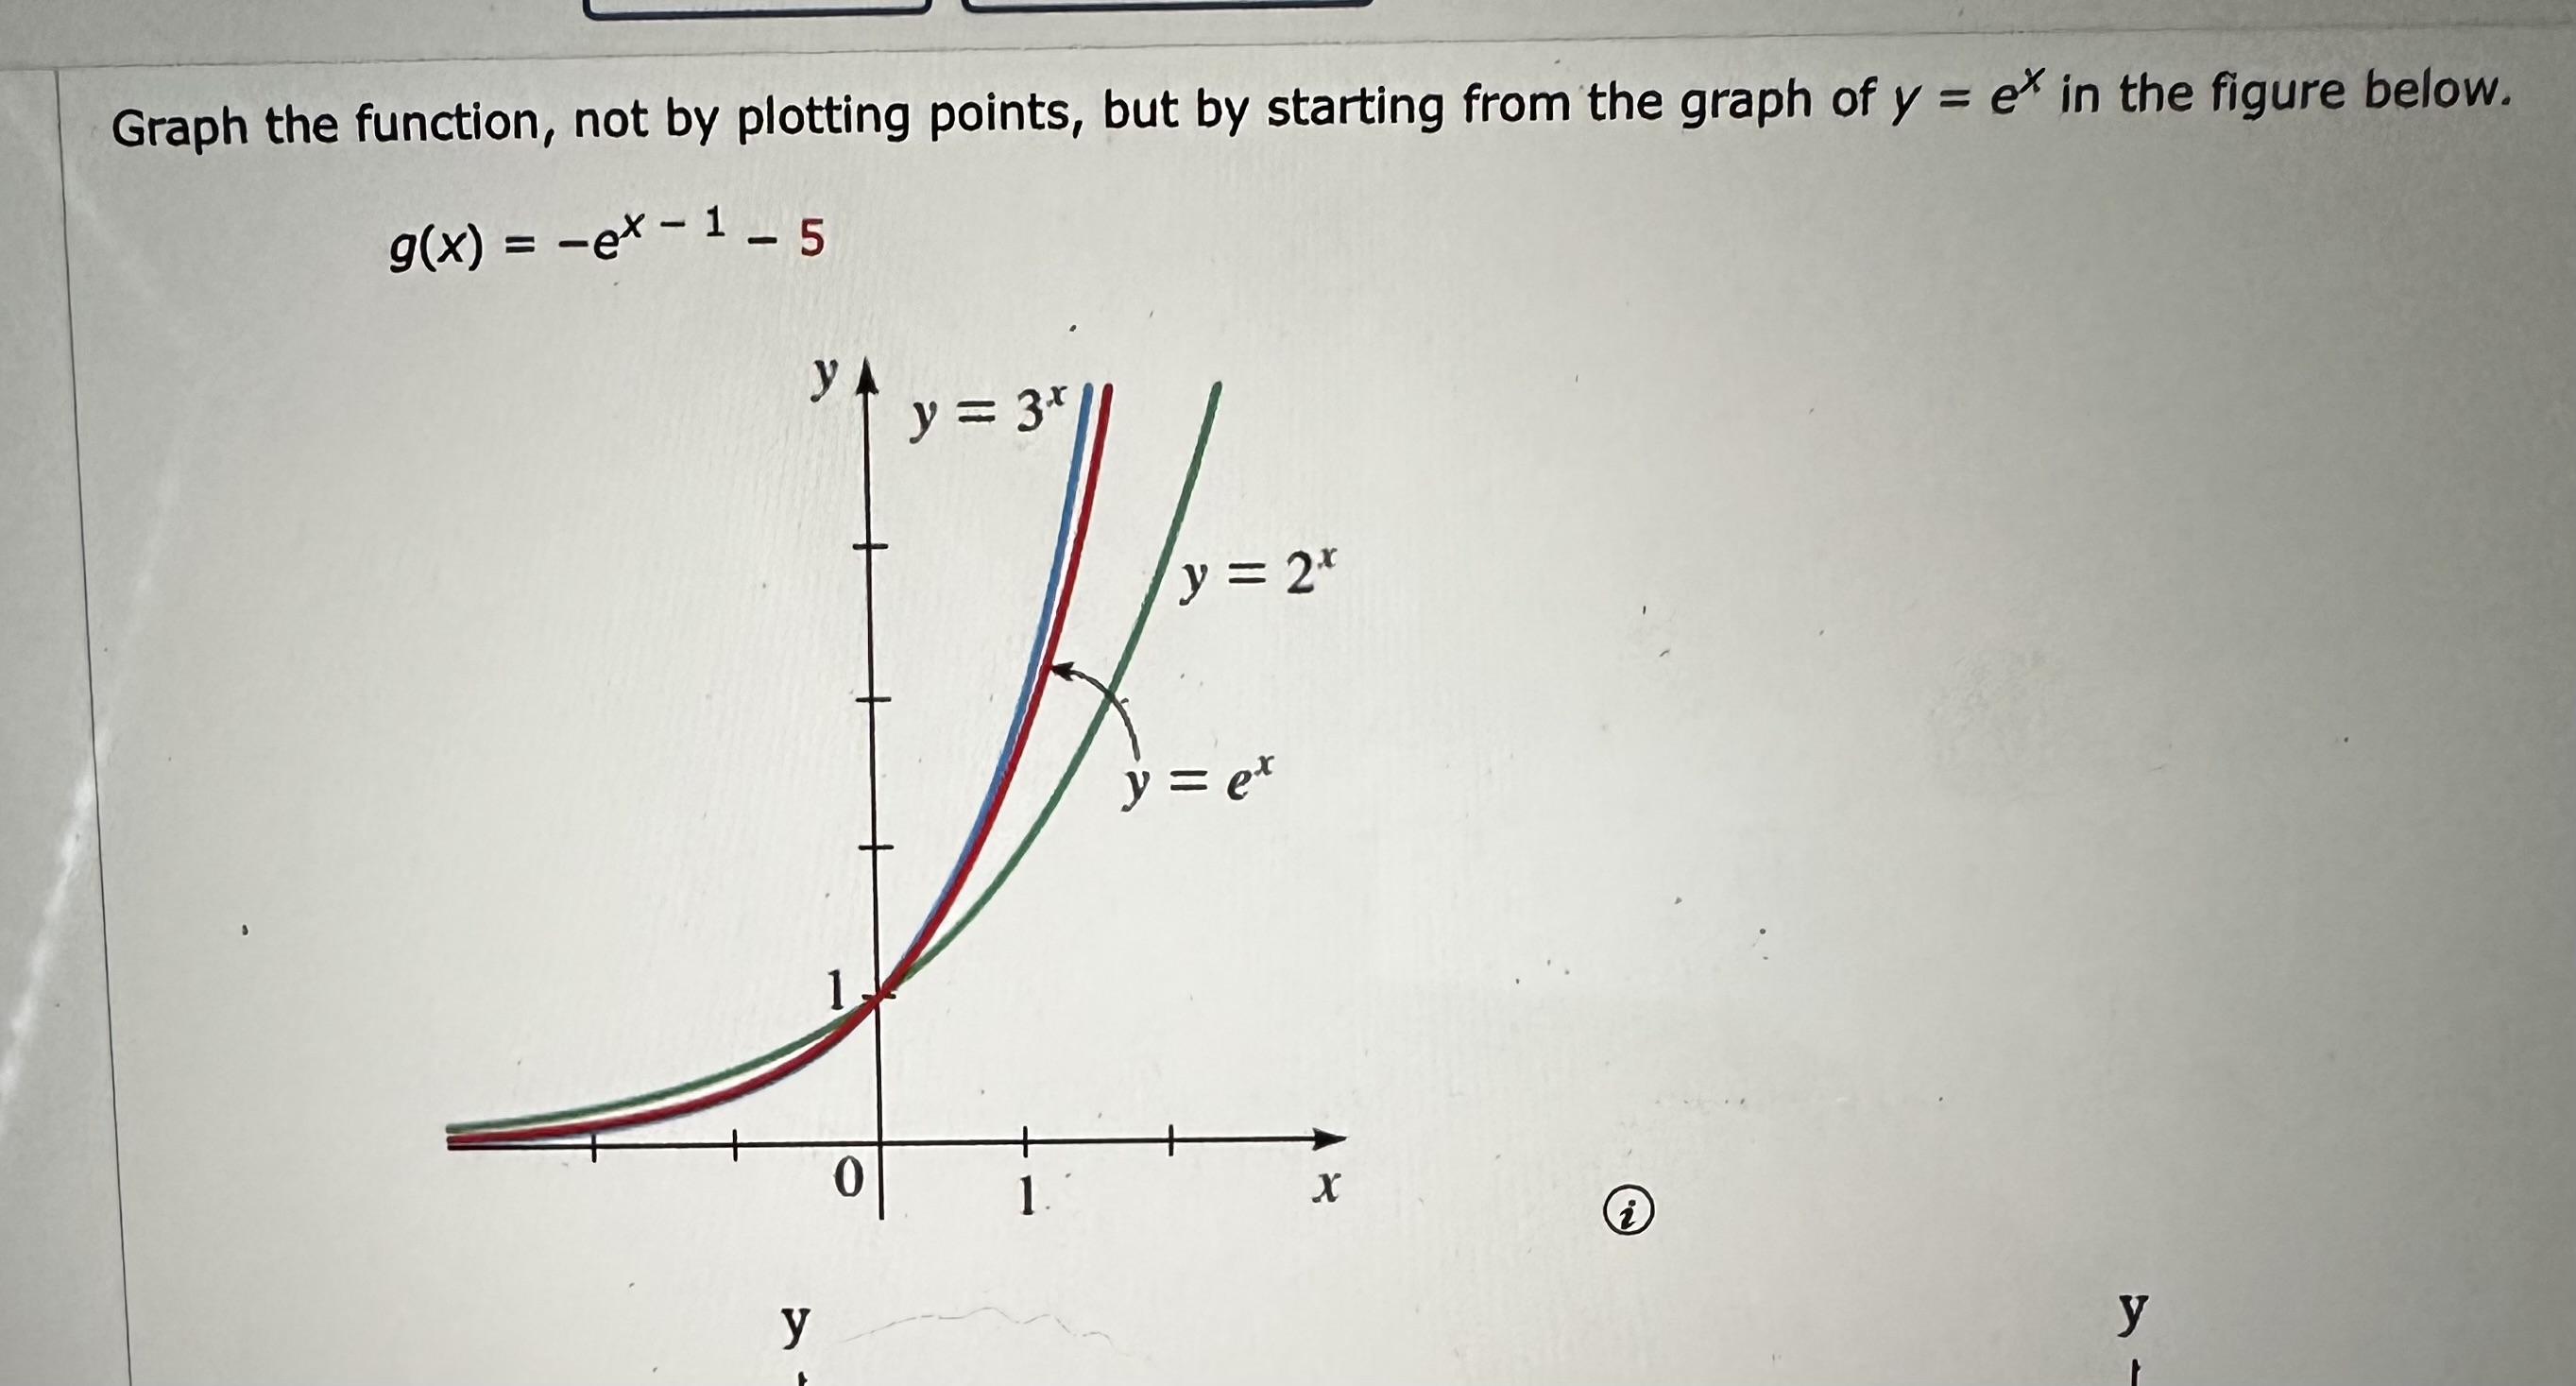
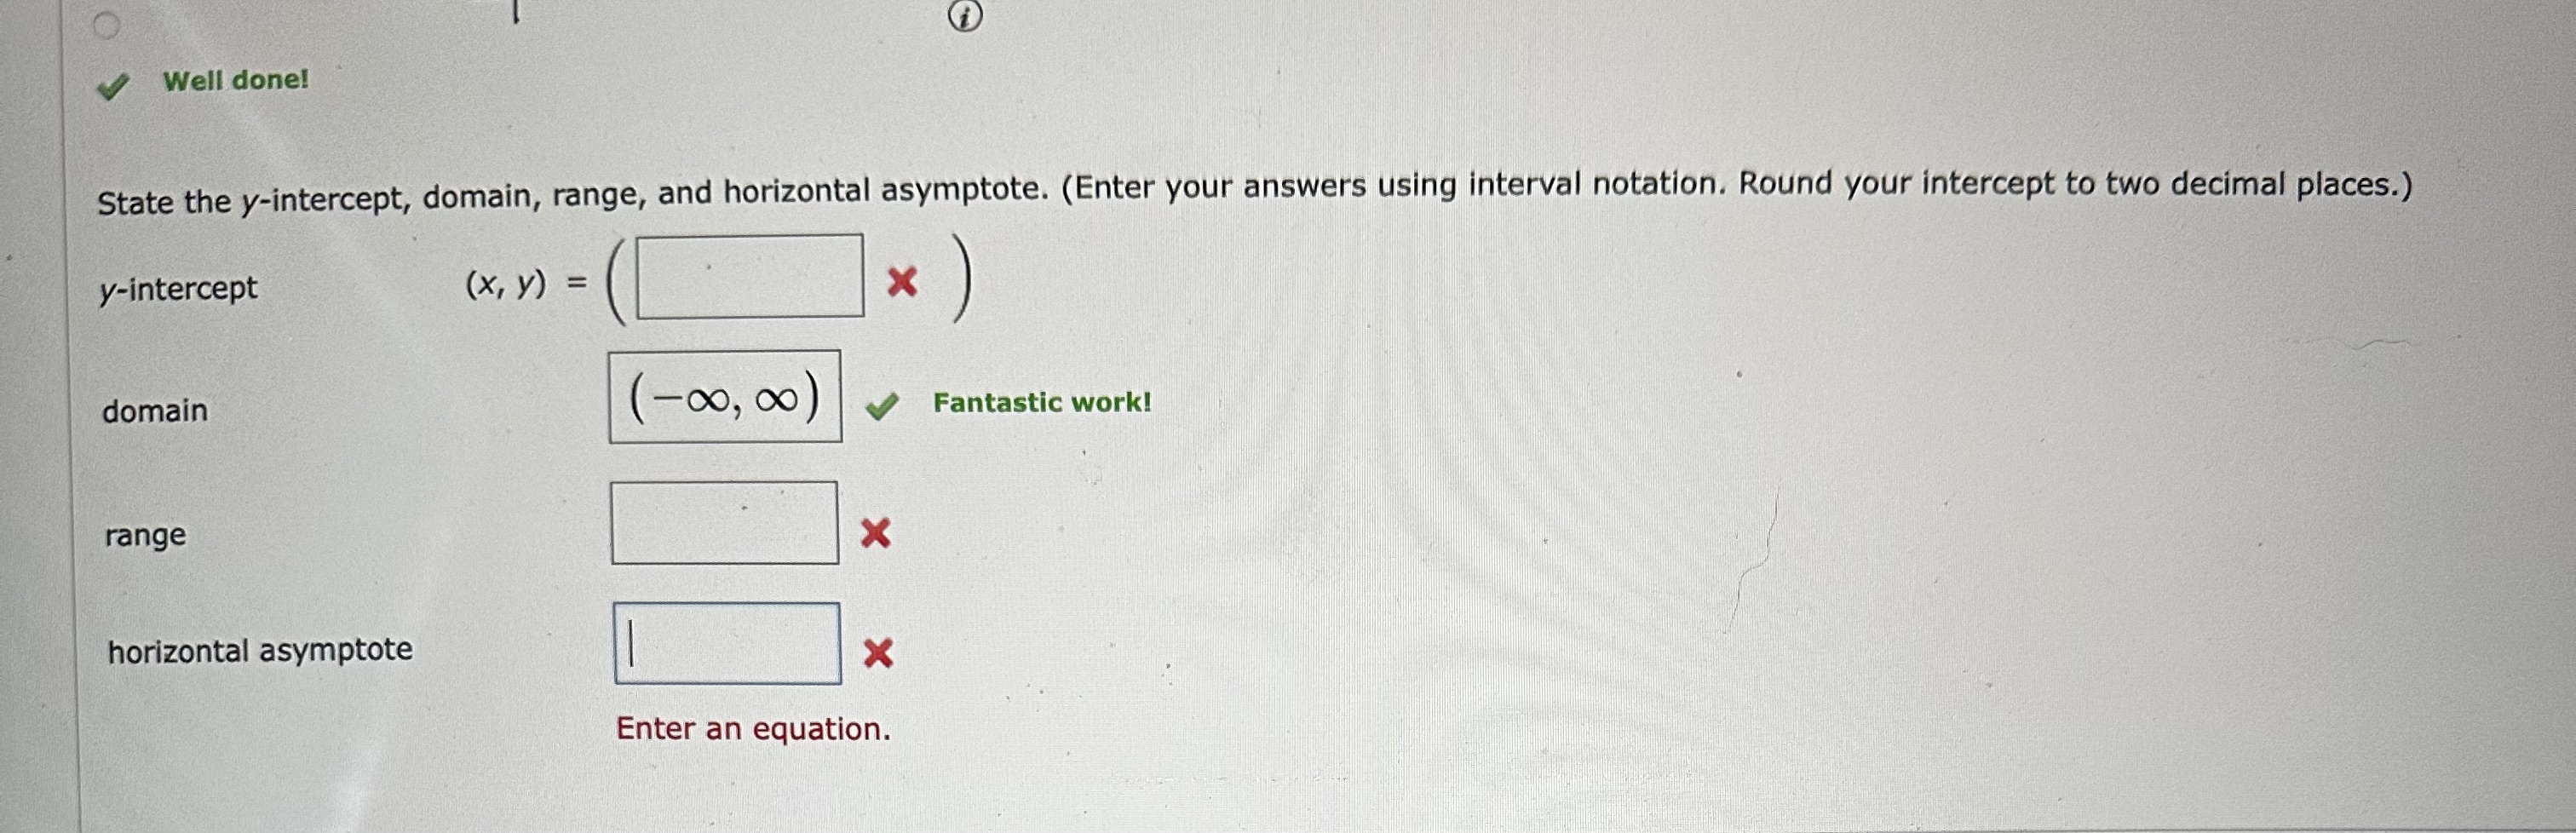
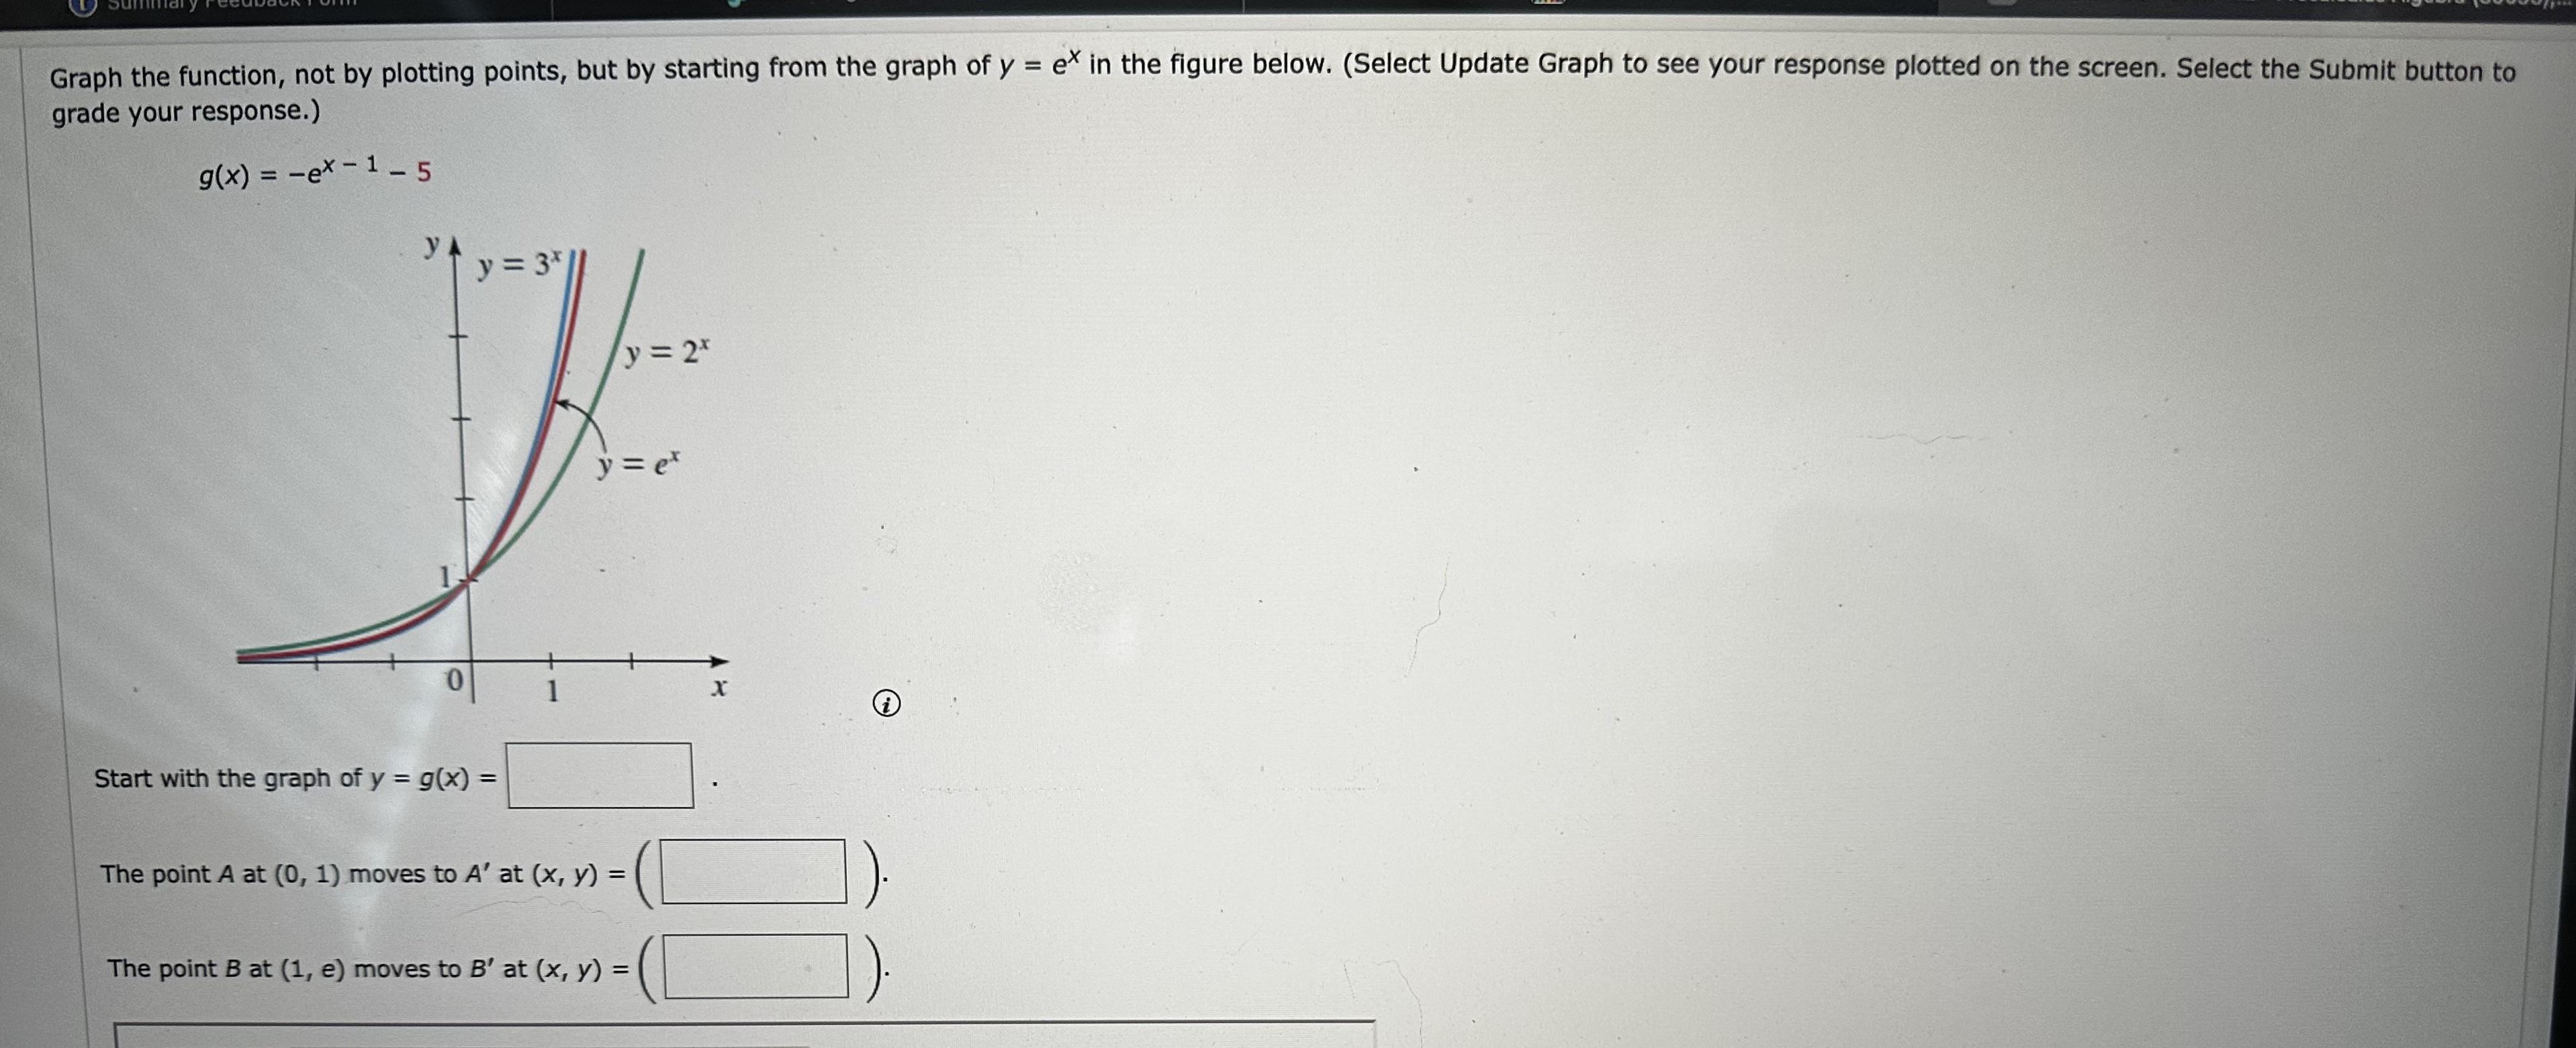
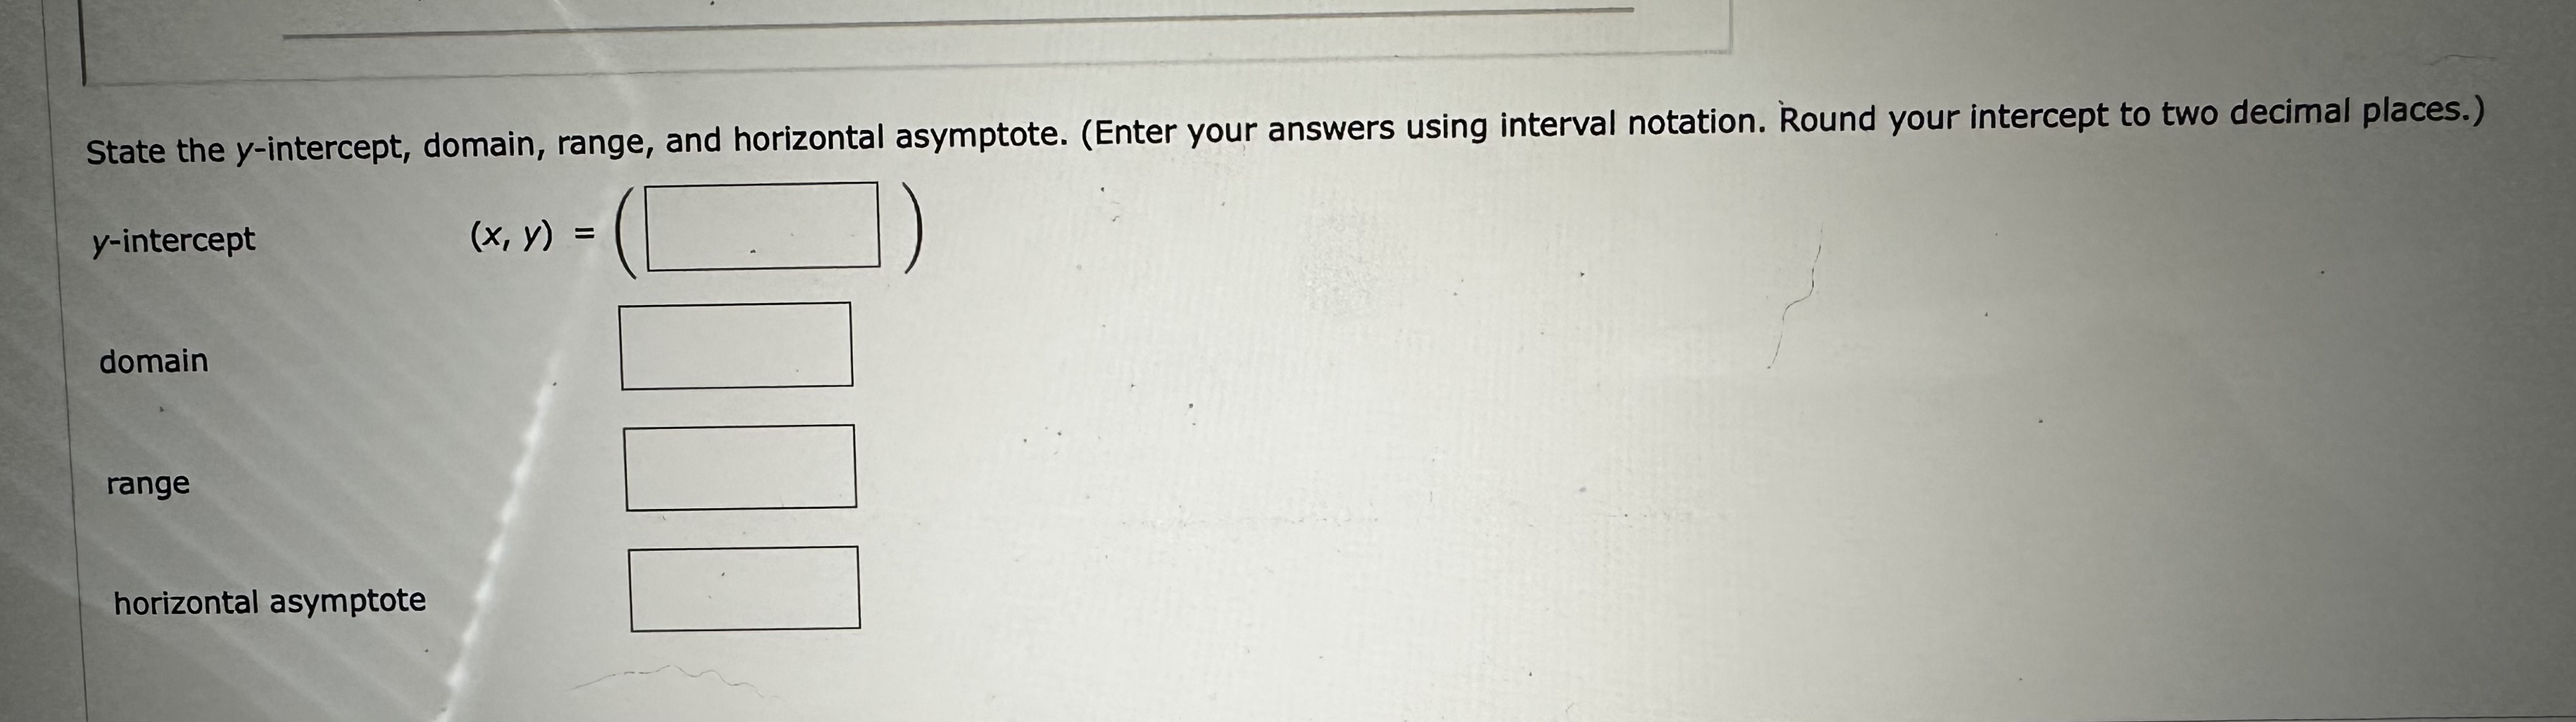
Graph the function, not by plotting points, but by starting from the graph of y = ex in the figure below. 9(X) = -ex- 1 - 5 YA y = 3x y = 2* y = ex 0 X i yWell done! State the y-intercept, domain, range, and horizontal asymptote. (Enter your answers using interval notation. Round your intercept to two decimal places.) y-intercept ( x, y ) = X domain (-00, 00) Fantastic work! range X horizontal asymptote X Enter an equation.Graph the function, not by plotting points, but by starting from the graph of y = ex in the figure below. (Select Update Graph to see your response plotted on the screen. Select the Submit button to grade your response.) g(x) = -ex -1 -5 y y = 3* 1 y = 2x y = ex X Start with the graph of y = g(x) = The point A at (0, 1) moves to A' at (x, y) = The point B at (1, e) moves to B' at (x, y) =State the y-intercept, domain, range, and horizontal asymptote. (Enter your answers using interval notation. Round your intercept to two decimal places.) y-intercept ( x, y ) = domain range horizontal asymptote
Step by Step Solution
There are 3 Steps involved in it

Get step-by-step solutions from verified subject matter experts