

Question: Graph the linear function 9. 8 (1 ) + x+7 10. p(x ) = -2r - 4 17 mile - 6 12 12. The function
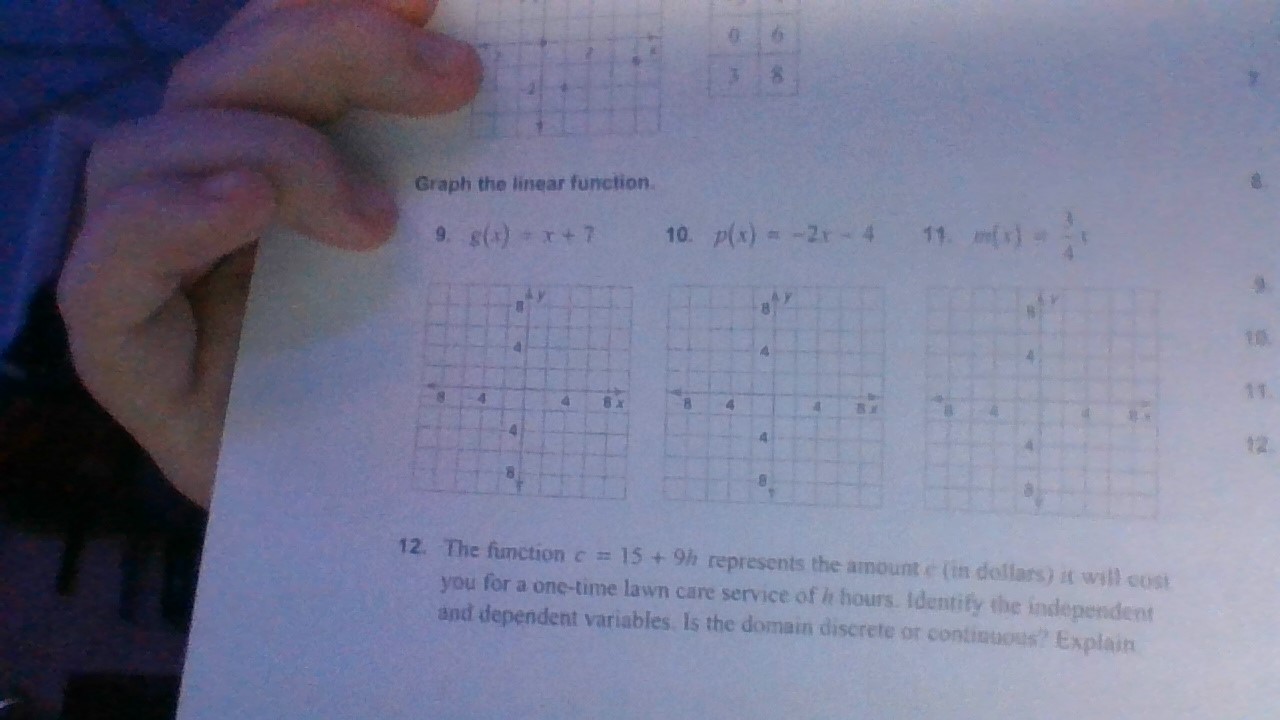
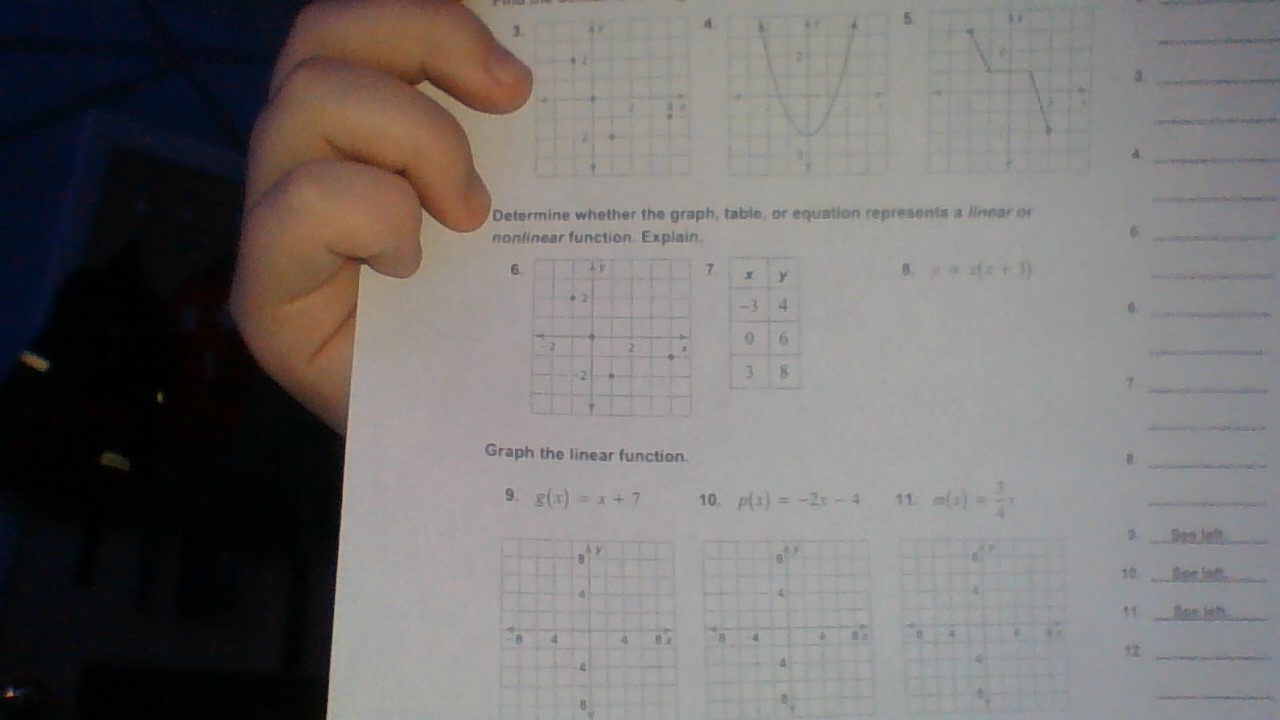
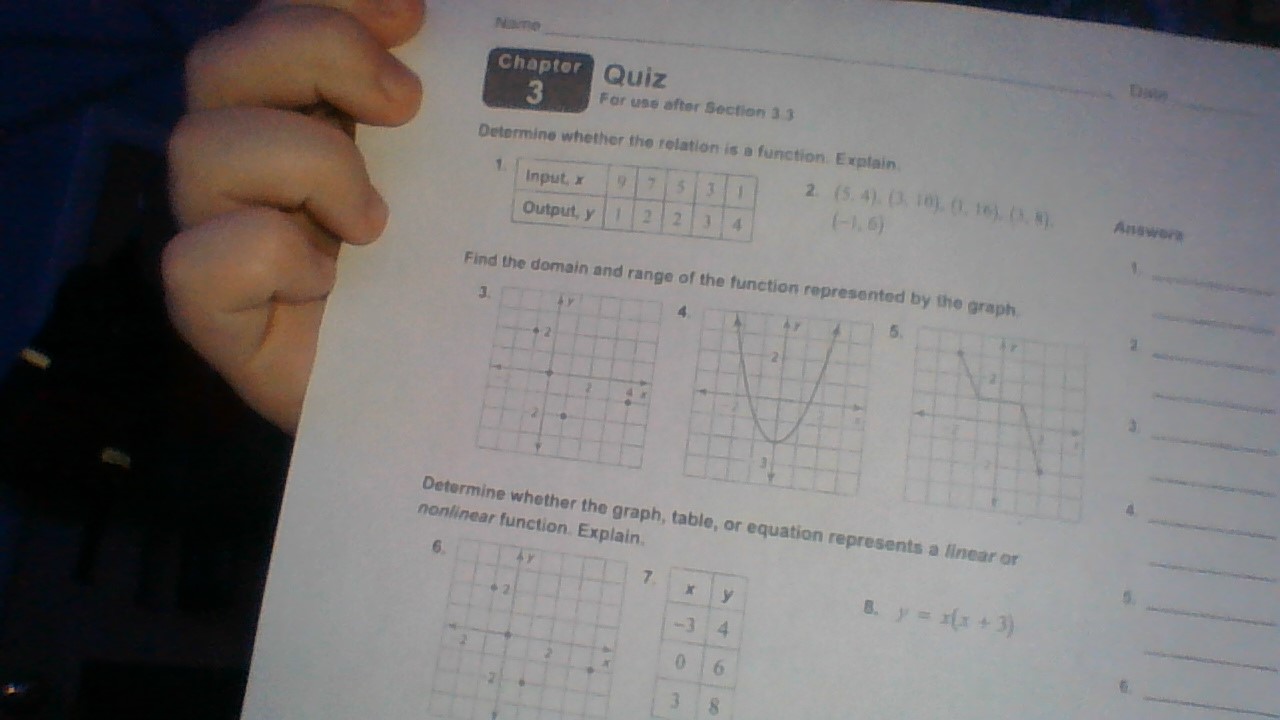
Graph the linear function 9. 8 (1 ) + x+7 10. p(x ) = -2r - 4 17 mile - 6 12 12. The function c = 15 + 9% represents the amount s (in dollars) it will cust you for a one-time lawn care service of h hours. Identify the independent and dependent variables. Is the domain discrete or continuous ExplainDetermine whether the graph, table, or equation represents a linear or nonlinear function Explain. G. Graph the linear function. 9. g(x) = x+7 10. p(a) = -2x -4 11 () - - etChapter Quiz 3 For use after Section 3.3 Determine whether the relation is a function Explain 1 Input * 2. (5. 4). (3, 10). 01, 16) (1. 3). Answers Output, y (-16) Find the domain and range of the function represented by the graph J. Determine whether the graph, table, or equation represents a linear or nonlinear function. Explain K 8. y = xx + 3)
Step by Step Solution
There are 3 Steps involved in it

Get step-by-step solutions from verified subject matter experts