

Question: Graph the production data, putting motorcycles on the horizontal axis. b. What are the opportunity costs of moving from point B to point D
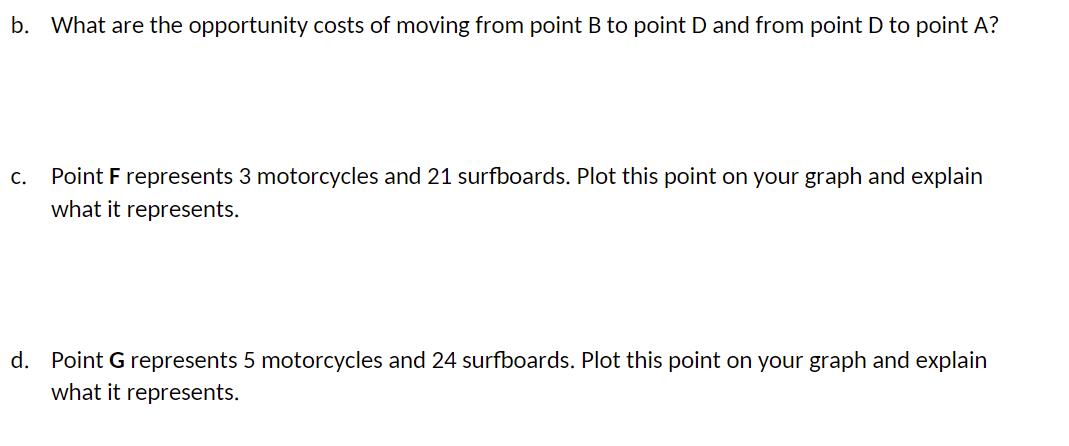
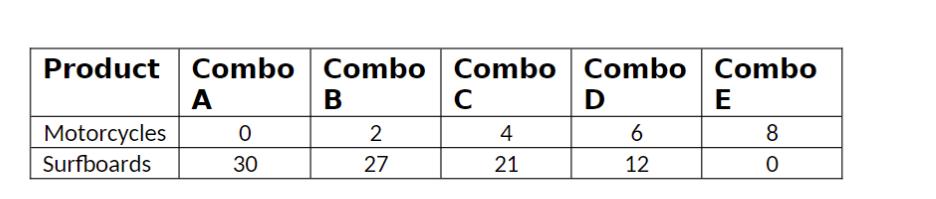
Graph the production data, putting motorcycles on the horizontal axis. b. What are the opportunity costs of moving from point B to point D and from point D to point A? C. Point F represents 3 motorcycles and 21 surfboards. Plot this point on your graph and explain what it represents. d. Point G represents 5 motorcycles and 24 surfboards. Plot this point on your graph and explain what it represents. Product Combo Combo Combo Combo A B C D Motorcycles Surfboards 0 30 2 27 4 21 6 12 Combo E 8 0
Step by Step Solution
There are 3 Steps involved in it
Answ... View full answer

Get step-by-step solutions from verified subject matter experts