

Question: GRAPH THE THREE YEAR DATA SET: - Create a line graph displaying the three data sets. - Be sure it has an appropriate title
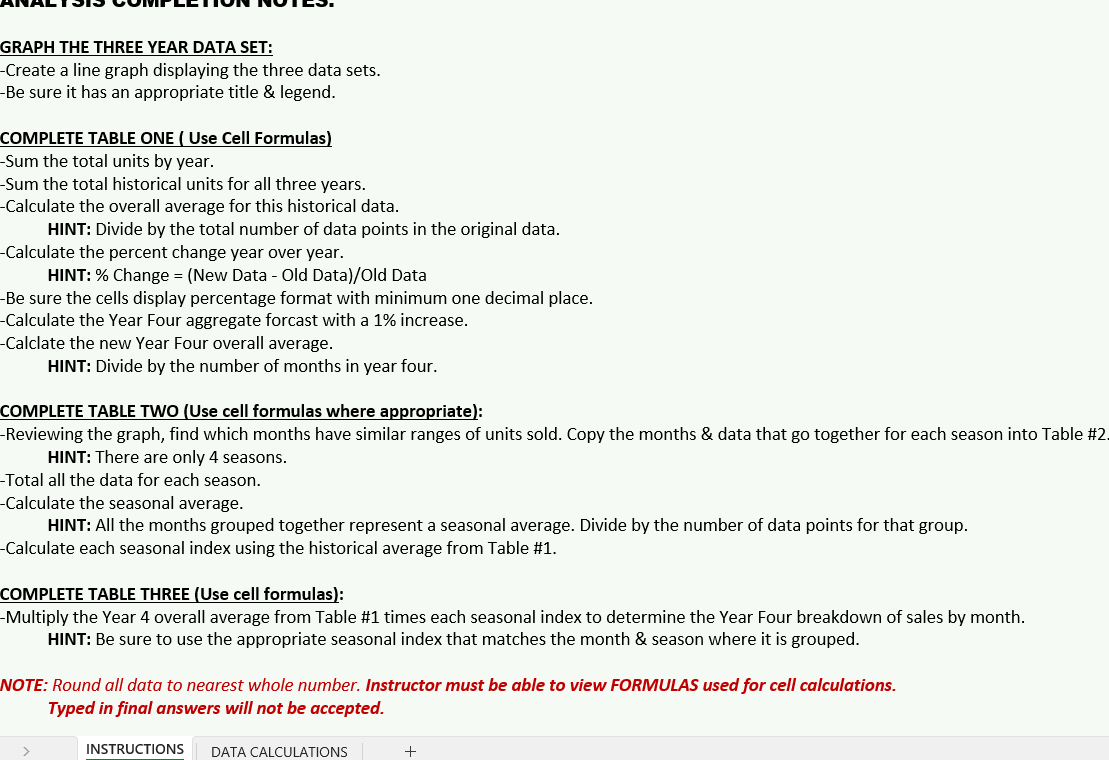
GRAPH THE THREE YEAR DATA SET:
Create a line graph displaying the three data sets.
Be sure it has an appropriate title & legend.
COMPLETE TABLE ONE Use Cell Formulas
Sum the total units by year.
Sum the total historical units for all three years.
Calculate the overall average for this historical data.
HINT: Divide by the total number of data points in the original data.
Calculate the percent change year over year.
HINT: Change New Data Old DataOld Data
Be sure the cells display percentage format with minimum one decimal place.
Calculate the Year Four aggregate forcast with a increase.
Calclate the new Year Four overall average.
HINT: Divide by the number of months in year four.
COMPLETE TABLE TWO Use cell formulas where appropriate:
Reviewing the graph, find which months have similar ranges of units sold. Copy the months & data that go together for each season into Table #
HINT: There are only seasons.
Total all the data for each season.
Calculate the seasonal average.
HINT: All the months grouped together represent a seasonal average. Divide by the number of data points for that group.
Calculate each seasonal index using the historical average from Table #
COMPLETE TABLE THREE Use cell formulas:
Multiply the Year overall average from Table # times each seasonal index to determine the Year Four breakdown of sales by month.
HINT: Be sure to use the appropriate seasonal index that matches the month & season where it is grouped.
NOTE: Round all data to nearest whole number. Instructor must be able to view FORMULAS used for cell calculations.
Typed in final answers will not be accepted. HOOVER BOARD MONTHLY DEMAND IN UNITS
TABLE ONE:
begintabularcccccc
hline Month & Year Units & Year Units & Year Units & &
hline January & & & & &
hline February & & & & &
hline March & & & & &
hline April & & & & &
hline May & & & & &
hline June & & & & &
hline July & & & & &
hline August & & & & &
hline September & & & & &
hline October & & & & & OVERALL
hline November & & & & & HISTORICAL
hline December & & & & & AVERAGE
hline TOTAL UNITS BY YEAR: & & & & &
hline multicolumnrPERCENT INCREASE:
YEAR OVER YEAR & & & &
hline multicolumnrbegintabularl
YEAR FOUR TOTAL UNIT FORECAST
Increase over Year
endtabular & &
hline & multicolumnrNEW YEAR FOUR OVERALL AVERAGE: & &
hline
endtabular
TABLE TWO:
begintabularllllllll
cline & Month & & & & begintabularc
TOTALOFALL
UNITS SOLD
WITHINASEASON
endtabular & begintabularc
SEASONAL
AVERAGE
endtabular & SEASONAL INDEX
endtabular
TABLE THREE:
begintabularrr
hline MONTH & begintabularr
YEAR FOUR
FORECAST
endtabular
hline January &
hline February &
hline March &
hline April &
hline May &
hline June &
hline July &
hline August &
hline September &
hline October &
hline November &
hline December &
hline
endtabular
Step by Step Solution
There are 3 Steps involved in it
1 Expert Approved Answer
Step: 1 Unlock

Question Has Been Solved by an Expert!
Get step-by-step solutions from verified subject matter experts
Step: 2 Unlock
Step: 3 Unlock