

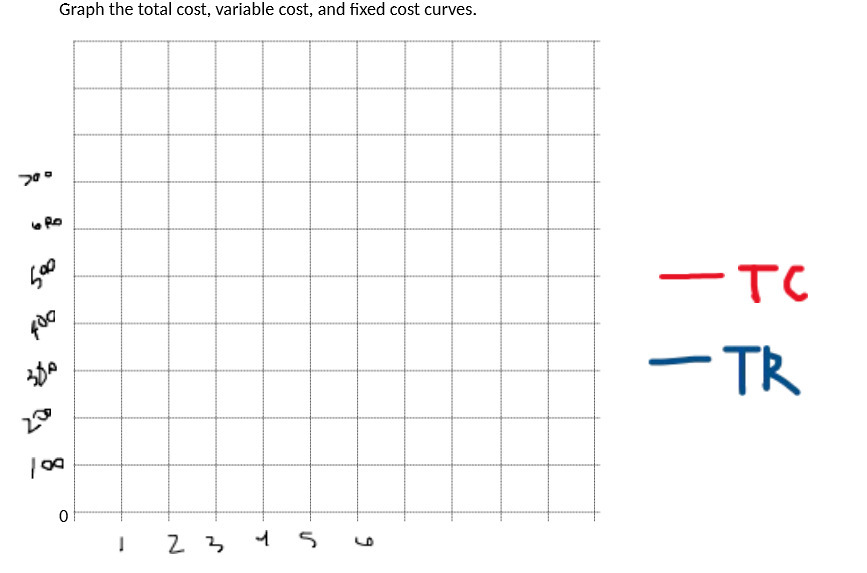
Question: Graph the total cost, variable cost, and fixed cost curves. 20 0 4 PO - TC 400 TR 20 I 2 3 45

Graph the total cost, variable cost, and fixed cost curves. 20 0 4 PO - TC 400 TR 20 I 2 3 45
Step by Step Solution
There are 3 Steps involved in it
1 Expert Approved Answer
Step: 1 Unlock

Question Has Been Solved by an Expert!
Get step-by-step solutions from verified subject matter experts
Step: 2 Unlock
Step: 3 Unlock