

Question: GRAPH USING EXCEL . Suppose different hospitals within the Partners system choose different mixes of the risk-free STP and the baseline LTP, whose future expected
GRAPH USING EXCEL . Suppose different hospitals within the Partners system choose different mixes of the risk-free STP and the baseline LTP, whose future expected returns and risks are shown in Exhibit 3. On Exhibit 3, plot the returns and risks of the various potential portfolios that can be formed by allocating funds between the STP and the baseline LTP. What shape does a line drawn through these portfolios take? Why?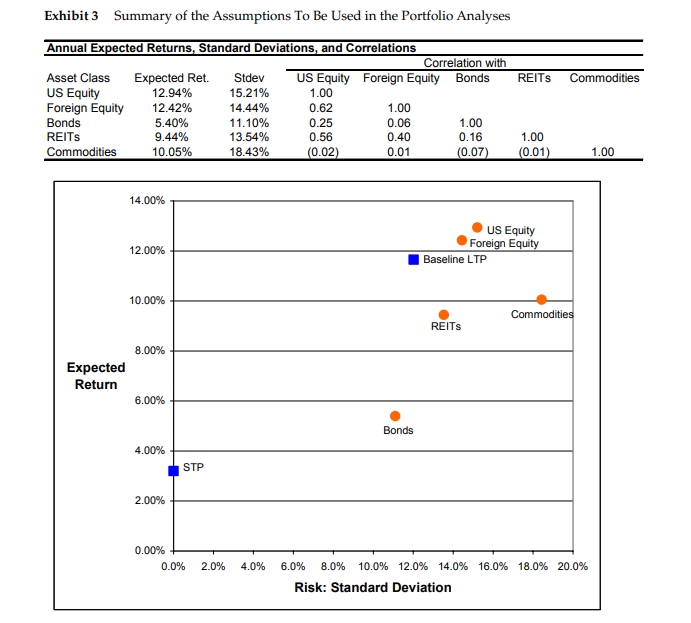
Exhibit 3 Summary of the Assumptions To Be Used in the Portfolio Analyses REITs Commodities Annual Expected Returns, Standard Deviations, and Correlations Correlation with Asset Class Expected Ret. Stdev US Equity Foreign Equity Bonds US Equity 12.94% 15.21% 1.00 Foreign Equity 12.42% 14.44% 0.62 1.00 Bonds 5.40% 11.10% 0.25 0.06 1.00 REITS 9.44% 13.54% 0.56 0.40 0.16 Commodities 10.05% 18.43% (0.02) 0.01 (0.07) 1.00 (0.01) 1.00 14.00% 12.00% US Equity Foreign Equity Baseline LTP 10.00% Commodities REITS 8.00% Expected Return 6.00% Bonds 4.00% STP 2.00% 0.00% + 0.0% 2.0% 4.0% 16.0% 18.0% 20.0% 6.0% 8.0% 10.0% 12.0% 14.0% Risk: Standard Deviation Exhibit 3 Summary of the Assumptions To Be Used in the Portfolio Analyses REITs Commodities Annual Expected Returns, Standard Deviations, and Correlations Correlation with Asset Class Expected Ret. Stdev US Equity Foreign Equity Bonds US Equity 12.94% 15.21% 1.00 Foreign Equity 12.42% 14.44% 0.62 1.00 Bonds 5.40% 11.10% 0.25 0.06 1.00 REITS 9.44% 13.54% 0.56 0.40 0.16 Commodities 10.05% 18.43% (0.02) 0.01 (0.07) 1.00 (0.01) 1.00 14.00% 12.00% US Equity Foreign Equity Baseline LTP 10.00% Commodities REITS 8.00% Expected Return 6.00% Bonds 4.00% STP 2.00% 0.00% + 0.0% 2.0% 4.0% 16.0% 18.0% 20.0% 6.0% 8.0% 10.0% 12.0% 14.0% Risk: Standard Deviation
Step by Step Solution
There are 3 Steps involved in it

Get step-by-step solutions from verified subject matter experts