

Question: graph using matlab 2. We have the following data for V(t) that follows an exponential dependence of the form of equation 7. Plot V vs.
graph using matlab 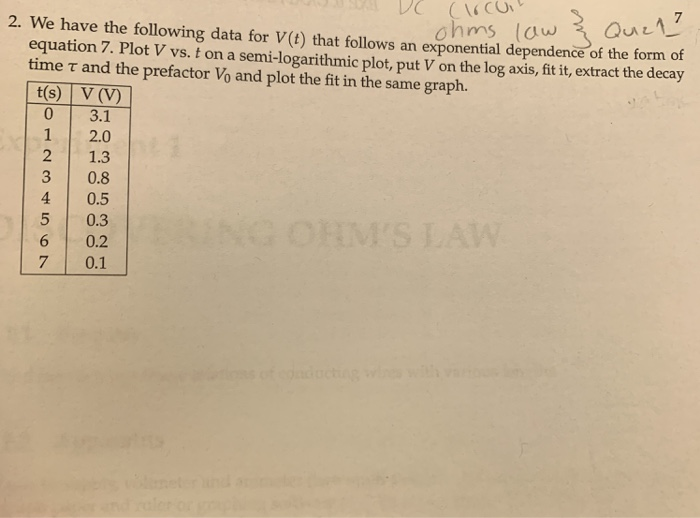
2. We have the following data for V(t) that follows an exponential dependence of the form of equation 7. Plot V vs. t on a semi-logarithmic plot, put V on the log axis, fit it, extract the decay time and the prefactor Vo and plot the fit in the same graph. t(s) VV) 0 3.1 1 2.0 2 1.3 3 0.8 4 0.5 5 0.3 6 0.2 7 0.1
Step by Step Solution
There are 3 Steps involved in it
1 Expert Approved Answer
Step: 1 Unlock

Question Has Been Solved by an Expert!
Get step-by-step solutions from verified subject matter experts
Step: 2 Unlock
Step: 3 Unlock