

Question: Graph Using one sheet of graph only but three separate graphs, one for each metal, and with each cathode metal ( cesium , potassium and
Graph
Using one sheet of graph only but three separate graphs, one for each metal, and with each cathode metal cesium potassium and sodium represented by a separately labelled line on graph. the versus frequency of radiant light frequency is the manipulated variable Make sure you have negative values on your vertical axis, similar to the graph on the computer screen. Label both axes and provide a title as well as a legend to explain your color code.
Calculations:
Rearrange the formula to isolate Planck's Constant. Calculate the value for h in each row where possible and take an average. Calculate the percentage error of your estimate use x as the actual valueNote: Since is zero for some frequency values, then an h value is not possible.
Calculate the slope of each graph, making sure to include units, and record these values below. In addition, be sure to label which slope is for which metal. What does this slope represent?
Show the comparison between your values for the work function from your graph versus the given work function in the table.
tableh from graph Jsh from table JsCesiumPotassiumSodium
Questions:
Explain what the difference is between intensity and frequency of the incident light.
What do the negative values of the yintercepts of the graphs represent? Why are they negative?
Suggest a reasons why every metal has a different work function and therefore would re
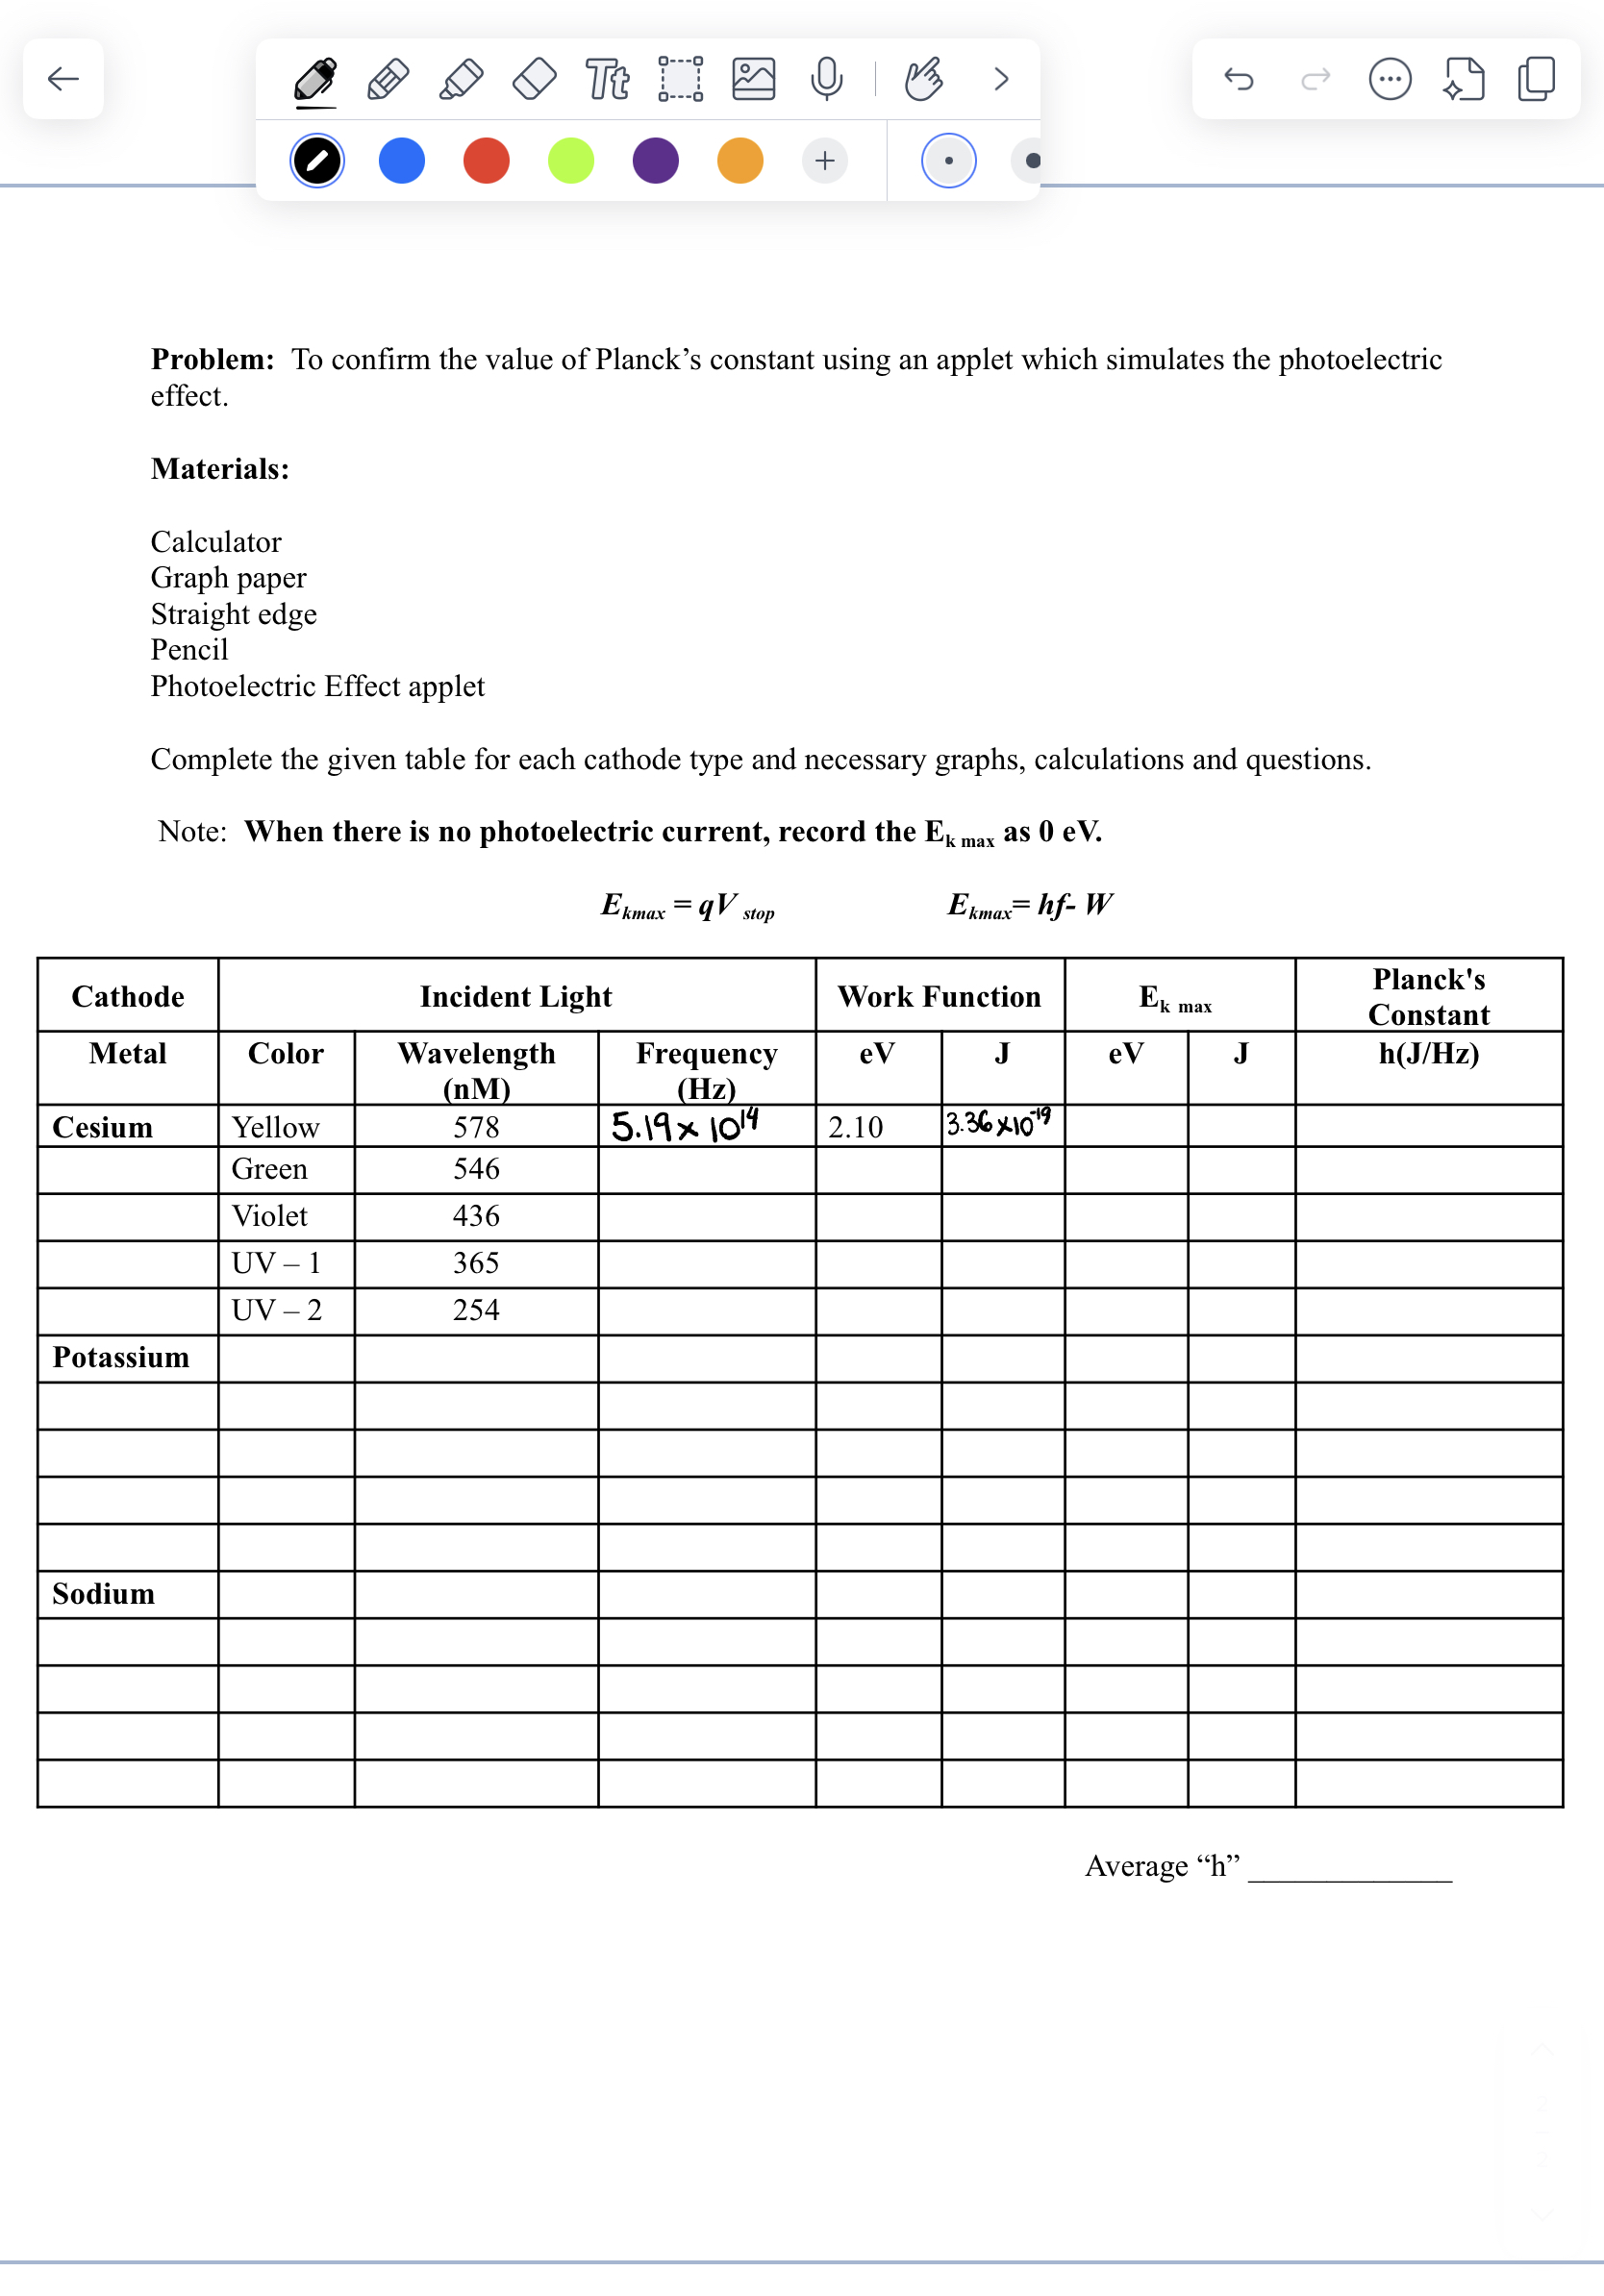
Problem: To confirm the value of Planck's constant using an applet which simulates the photoelectric effect.
Materials:
Calculator
Graph paper
Straight edge
Pencil
Photoelectric Effect applet
Complete the given table for each cathode type and necessary graphs, calculations and questions.
Note: When there is no photoelectric current, record the as
tableCathodeIncident Light,Work Function,tablePlancksConstantMetalColor,Wavelength nMtableFrequencyHzeVJeVJhJHzCesiumYellow,Green,Violet,UV UV PotassiumSodium
Average hquire a different threshold frequency of the incident light for emission of photoelectrons to occur.
Why are the stopping voltages for some wavelengths a value of zero?
Step by Step Solution
There are 3 Steps involved in it
1 Expert Approved Answer
Step: 1 Unlock

Question Has Been Solved by an Expert!
Get step-by-step solutions from verified subject matter experts
Step: 2 Unlock
Step: 3 Unlock