

Question: Graph X axis is Time Y axis is Inventory available PROBLEM #4 Find the economic number of orders and the point of reordering, given: Annual
Graph
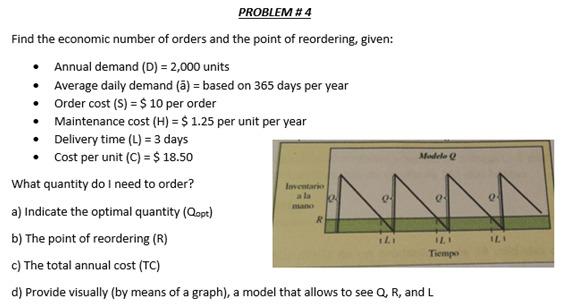
X axis is Time
Y axis is Inventory available
PROBLEM #4 Find the economic number of orders and the point of reordering, given: Annual demand (D) = 2,000 units Average daily demand (a) = based on 365 days per year Order cost (S) = $ 10 per order Maintenance cost (H) = $ 1.25 per unit per year Delivery time (L) = 3 days Cost per unit (C) = $ 18.50 What quantity do I need to order? a) Indicate the optimal quantity (opt) b) The point of reordering (R) Tiempo c) The total annual cost (TC) d) Provide visually (by means of a graph), a model that allows to see Q, R, and L Modele Inventario 0 R ILStep by Step Solution
There are 3 Steps involved in it
1 Expert Approved Answer
Step: 1 Unlock

Question Has Been Solved by an Expert!
Get step-by-step solutions from verified subject matter experts
Step: 2 Unlock
Step: 3 Unlock