

Question: Graphical Solution and Range of Optimality for Objective Function Coefficients. Consider the linear program below and answer the following. LO 1 , 4 Min 8
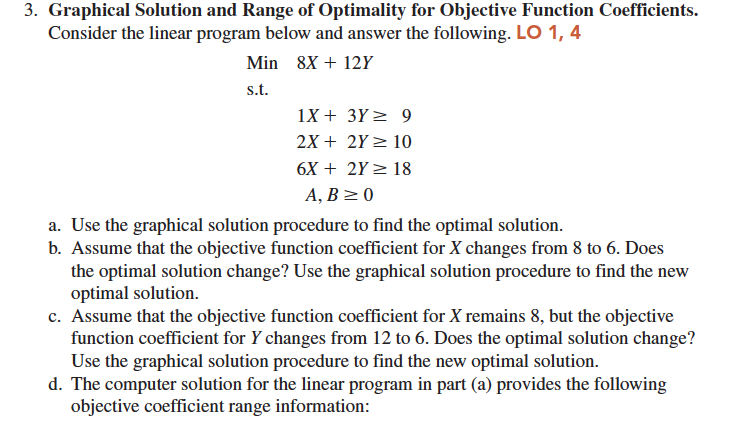
Graphical Solution and Range of Optimality for Objective Function Coefficients.
Consider the linear program below and answer the following. LO
Min
a Use the graphical solution procedure to find the optimal solution.
b Assume that the objective function coefficient for changes from to Does
the optimal solution change? Use the graphical solution procedure to find the new
optimal solution.
c Assume that the objective function coefficient for remains but the objective
function coefficient for changes from to Does the optimal solution change?
Use the graphical solution procedure to find the new optimal solution.
d The computer solution for the linear program in part a provides the following
objective coefficient range information:
solve this with excell please
Step by Step Solution
There are 3 Steps involved in it
1 Expert Approved Answer
Step: 1 Unlock

Question Has Been Solved by an Expert!
Get step-by-step solutions from verified subject matter experts
Step: 2 Unlock
Step: 3 Unlock