

Question: Graphical Solution Procedure Set up the graph so that X1 is on the horizontal axis, X2 is on the vertical axis 2. Graph each constraint
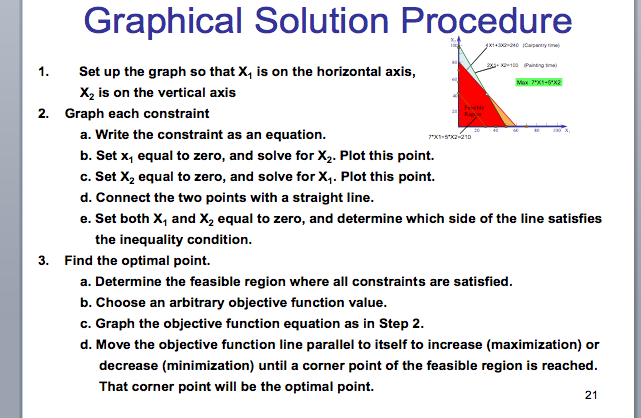
Graphical Solution Procedure Set up the graph so that X1 is on the horizontal axis, X2 is on the vertical axis 2. Graph each constraint a. Write the constraint as an equation. b. Set x1 equal to zero, and solve for X2. Plot this point. c. Set X2 equal to zero, and solve for X1. Plot this point. d. Connect the two points with a straight line. e. Set both X1 and X2 equal to zero, and determine which side of the line satisfies the inequality condition. 3. Find the optimal point. a. Determine the feasible region where all constraints are satisfied. b. Choose an arbitrary objective function value. c. Graph the objective function equation as in Step 2. d. Move the objective function line parallel to itself to increase (maximization) or decrease (minimization) until a corner point of the feasible region is reached. That corner point will be the optimal point. Graphical Solution Procedure Set up the graph so that X1 is on the horizontal axis, X2 is on the vertical axis 2. Graph each constraint a. Write the constraint as an equation. b. Set x1 equal to zero, and solve for X2. Plot this point. c. Set X2 equal to zero, and solve for X1. Plot this point. d. Connect the two points with a straight line. e. Set both X1 and X2 equal to zero, and determine which side of the line satisfies the inequality condition. 3. Find the optimal point. a. Determine the feasible region where all constraints are satisfied. b. Choose an arbitrary objective function value. c. Graph the objective function equation as in Step 2. d. Move the objective function line parallel to itself to increase (maximization) or decrease (minimization) until a corner point of the feasible region is reached. That corner point will be the optimal point
Step by Step Solution
There are 3 Steps involved in it

Get step-by-step solutions from verified subject matter experts