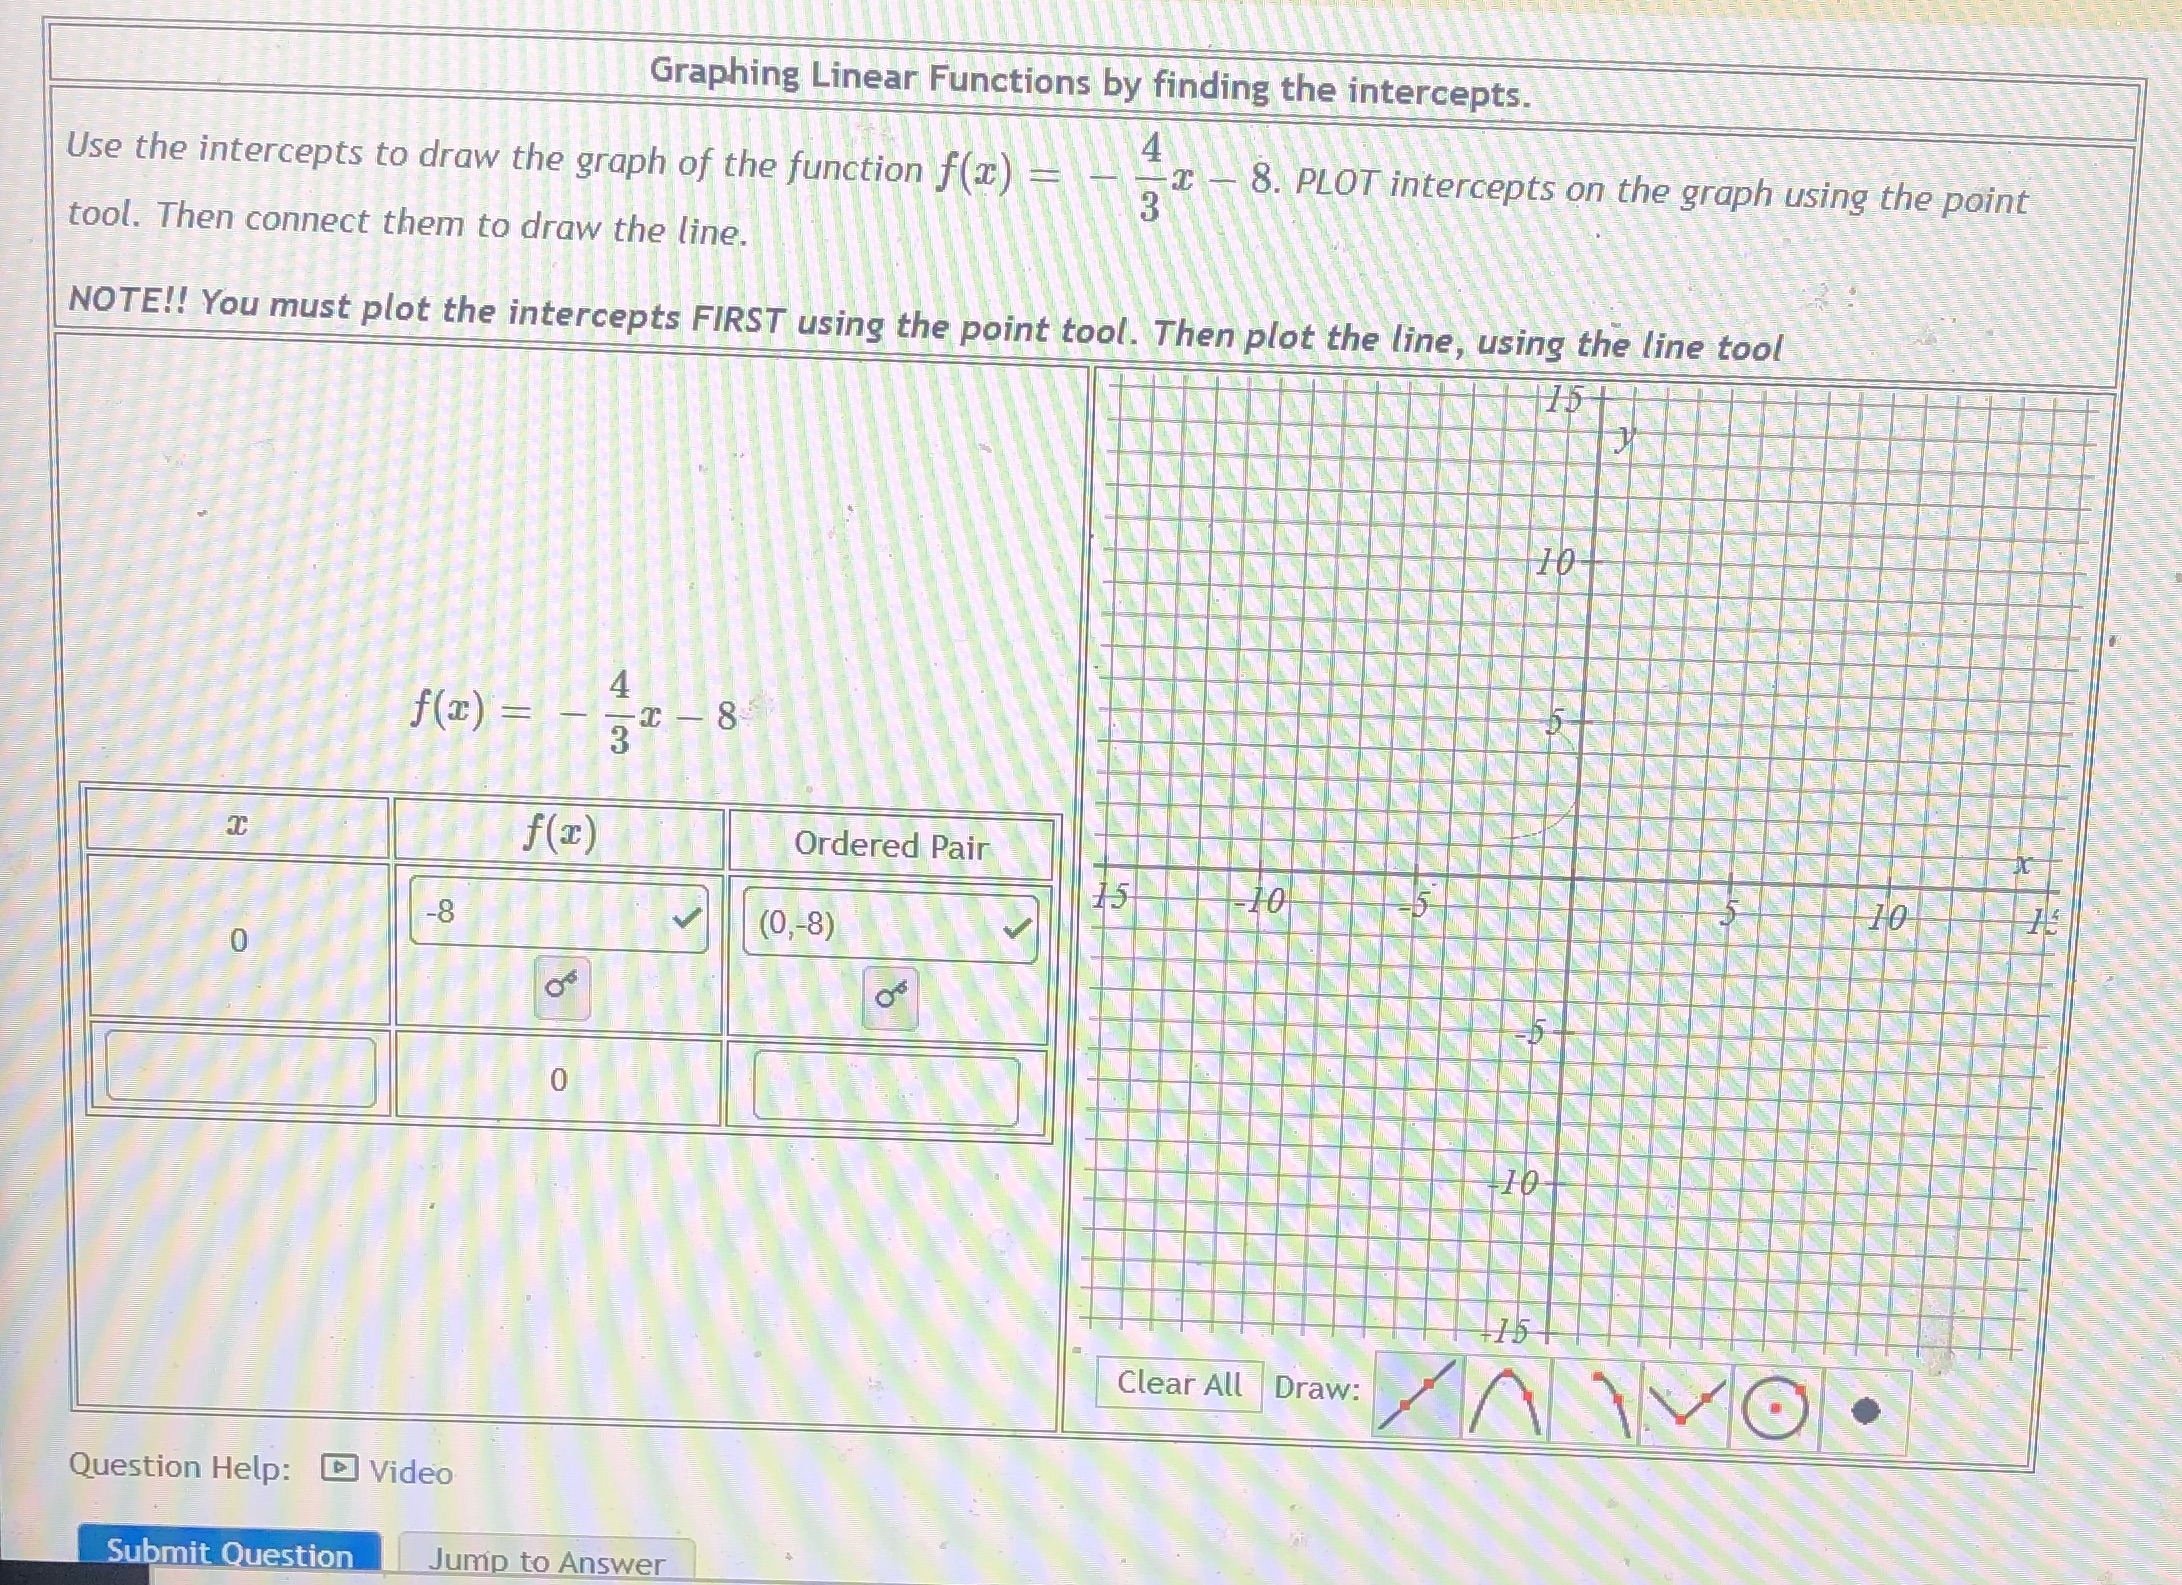
Question: Graphing Linear Functions by finding the intercepts. Use the intercepts to draw the graph of the function f() 4 8. PLOT intercepts on the graph

Graphing Linear Functions by finding the
Graphing Linear Functions by finding the intercepts. Use the intercepts to draw the graph of the function f() 4 8. PLOT intercepts on the graph using the point tool. Then connect them to draw the line. NOTE!! You must plot the intercepts FIRST using the point tool. Then plot the line, using the line tool 10 8 f(I) Ordered Pair 15 -10 -8 (0,-8) 0 Clear All DrawANOp Question Help: Video Submit Question Jump to

Step by Step Solution

There are 3 Steps involved in it

1 Expert Approved Answer
Step: 1 Unlock blur-text-image
Question Has Been Solved by an Expert!

Get step-by-step solutions from verified subject matter experts

Step: 2 Unlock
Step: 3 Unlock

Students Have Also Explored These Related Mathematics Questions!