

Question: Graphing Tool https://f1.app.edmentum.com/tools/graph/index Growth Rates of Functions This activity will help you meet these educational goals: Mathematical Practices?You will make sense of problems and solve
Graphing Tool https://f1.app.edmentum.com/tools/graph/index
Growth Rates of Functions
This activity will help you meet these educational goals:
Mathematical Practices?You will make sense of problems and solve them, use mathematics to model real-world situations, use appropriate tools strategically, attend to precision, look for and make use of structure, and look for and express regularity in repeated reasoning.
Directions
Read the instructions for this self-checked activity.Type in your response to each question, and check your answers.
Activity
Go to your math tools and open the Graph tool (See link above. Copy and paste in browser.)To create a graph, select the linear relationship and then enter values formandb.
Part A
Graph the linear functiony= 2x+ 1.Take a screenshot of your graph and paste it below.
Part B
Graph the quadratic functiony=(x2+1)2
.Take a screenshot of your graph and paste it below.
Part C
Graph the exponential functiony=(74)x
.Take a screenshot of your graph, and paste it below.
Part D
For each of the three functions, find they-values for thex-values given in the table and complete the table.
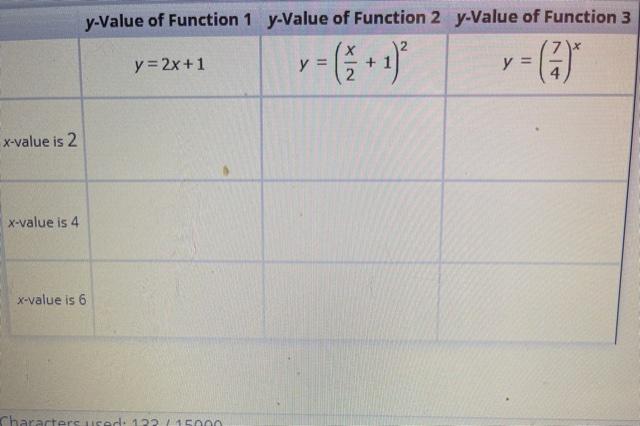
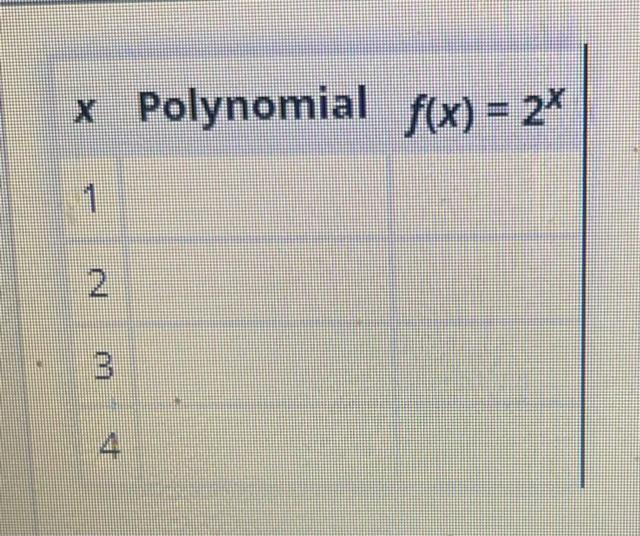
y-Value of Function 1 y-Value of Function 2 y-Value of Function 3 2 y = 2x+1 y y x-value is 2 x-value is 4 x-value is 6x Polynomial f(x) = 2x IN - B 4
Step by Step Solution
There are 3 Steps involved in it

Get step-by-step solutions from verified subject matter experts