

Question: Graphs On each graph you will plot two sets of data: the experimental data and the theoretical data. This will give you a visual comparison

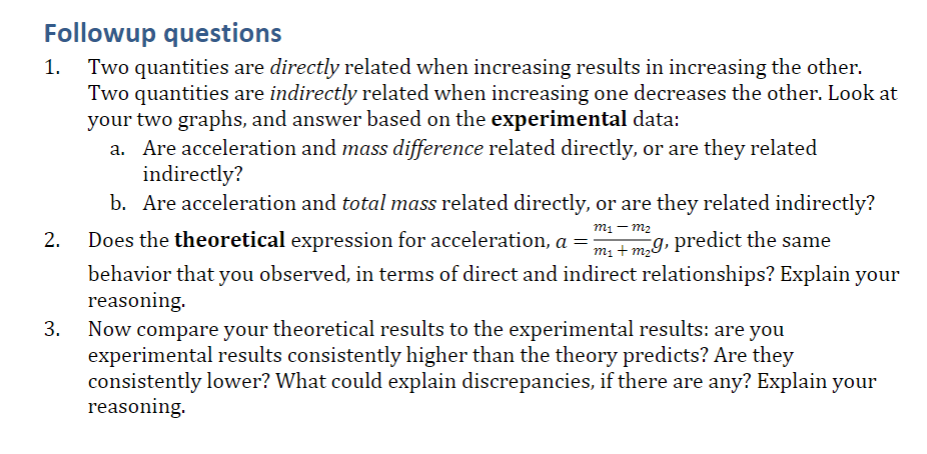
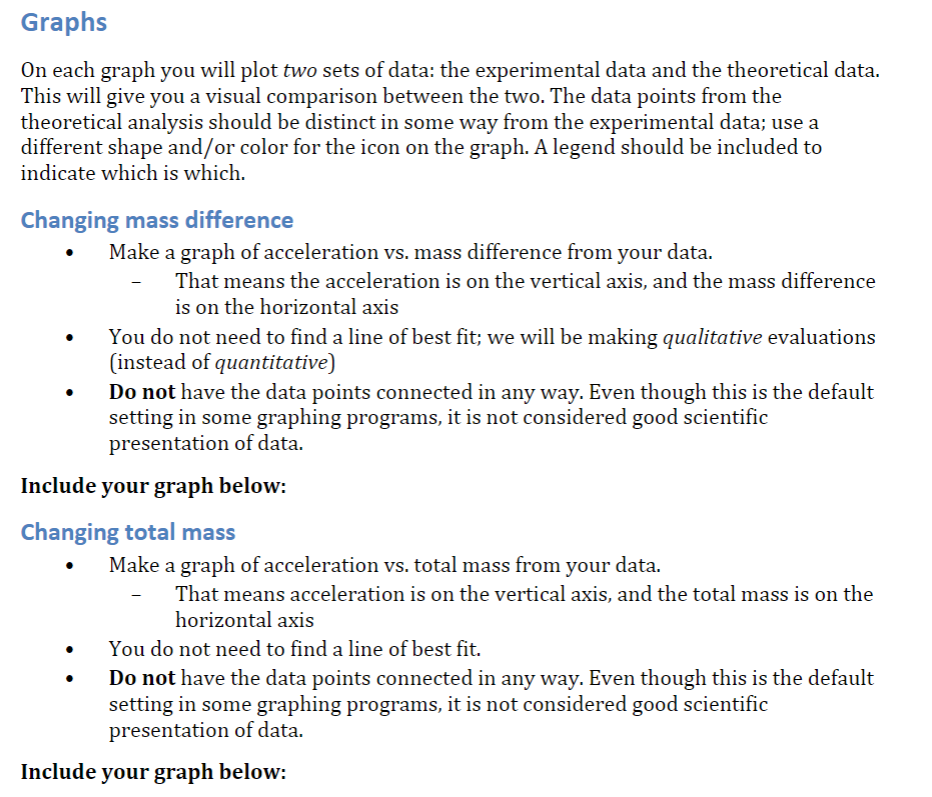


Graphs On each graph you will plot two sets of data: the experimental data and the theoretical data. This will give you a visual comparison between the two. The data points from the theoretical analysis should be distinct in some way from the experimental data: use a different shape andf or color for the icon on the graph. A legend should be included to indicate which is which. Changing mass difference I Make a graph of acceleration vs. mass difference from your data. That means the acceleration is on the vertical axis, and the mass difference is on the horizontal axis I You do not need to nd a line of best t; we will be making qualitative evaluations [instead of quantitative] I Do not have the data points connected in any way. Even though this is the default setting in some graphing programs, it is not considered good scientic presentation of data. Include your graph below: Changing total mass I Make a graph of acceleration vs. total mass from your data. That means acceleration is on the vertical axis, and the total mass is on the horizontal axis I You do not need to nd a line of best t. I Do not have the data points connected in any way. Even though this is the default setting in some graphing programs, it is not considered good scientic presentation of data. Include your graph below: Followup questions 1. Two quantities are directbr related when increasing results in increasing the other. Two quantities are indirectbz related when increasing one decreases the other. Look at your two graphs, and answer based on the experimental data: a. Are acceleration and mass derence related directly, or are they related indirectly? b. Are acceleration and total mass related directly, or are they related indirectly? m1 m2 1111 + in: behavior that you observed, in terms of direct and indirect relationships? Explain your reasoning. Does the theoretical expression for acceleration, a = g, predict the same Now compare your theoretical results to the experimental results: are you experimental results consistently higher than the theory predicts? Are they consistently lower? What could explain discrepancies, if there are any? Explain your reasoning. Followup questions 1. Responses to question 1 are consistent with the experimental data presented. 2. Response to question 2 is consistent with the theoretical data presented. Response is explained fullyr and clearly explained. 3. Response to question 3 is consistent with the data presented. Response is complete and reasoning is explained clearly. 4-. Responses to questions 2 and 3 are written in complete sentences following spelling and grammar conventions appropriate to professional science communication
Step by Step Solution
There are 3 Steps involved in it

Get step-by-step solutions from verified subject matter experts