

Question: Group A Group B X Y X 1 10.1 6 16 2 9.5 7 14.6 3 8.1 8 13.2 4 8.9 9 11.6 5
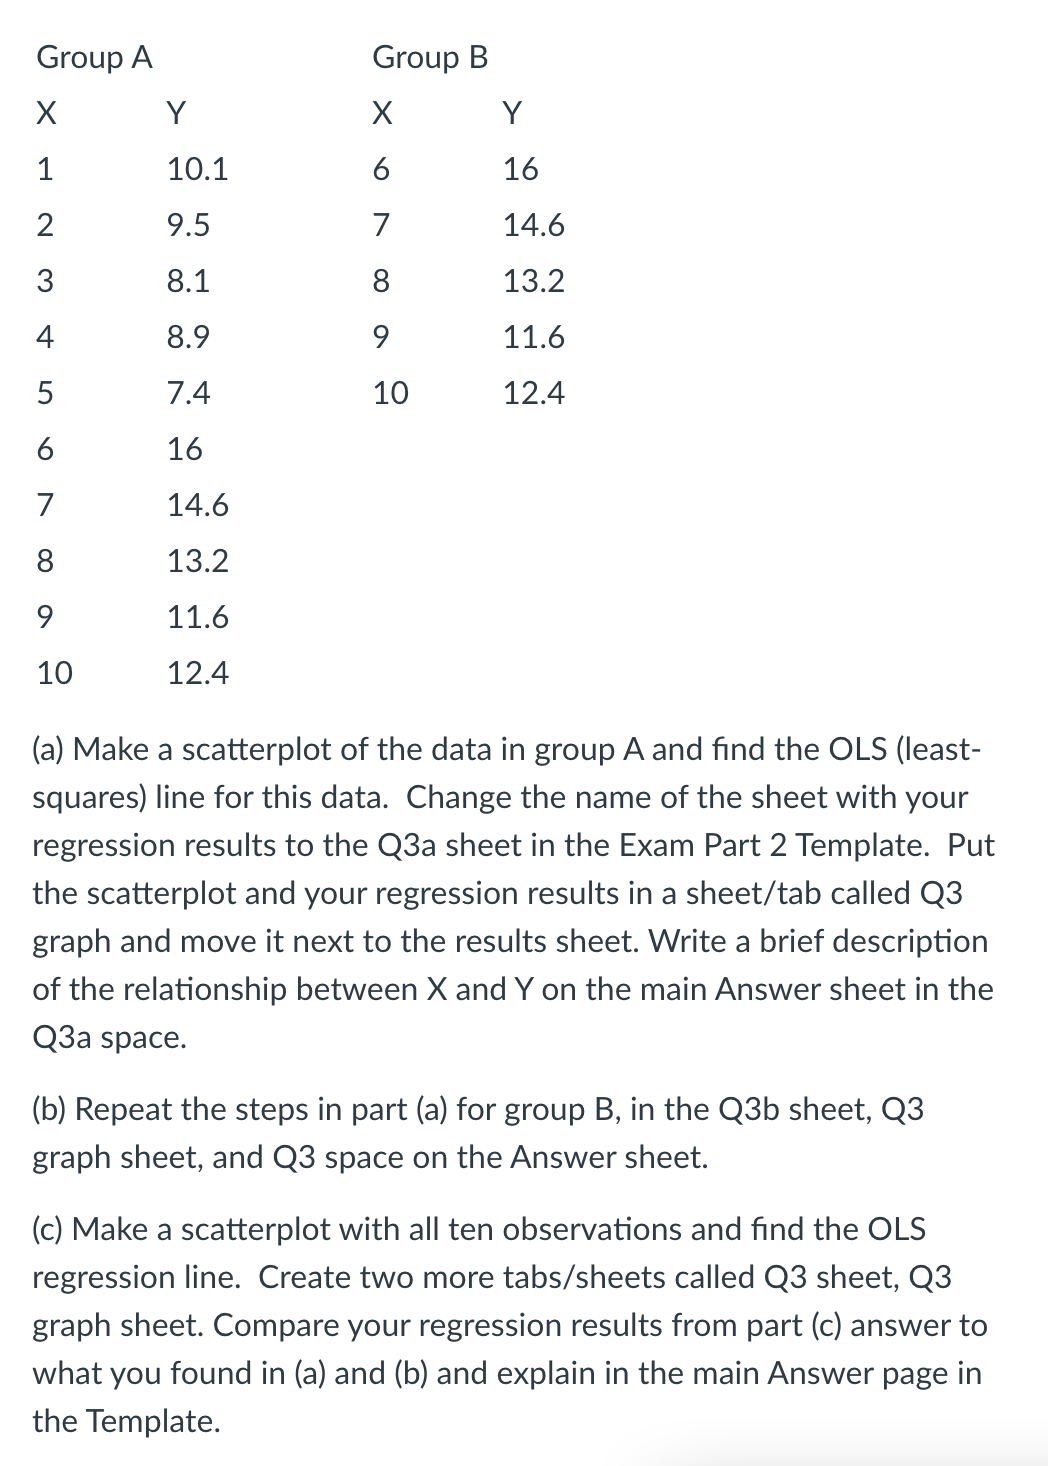
Group A Group B X Y X 1 10.1 6 16 2 9.5 7 14.6 3 8.1 8 13.2 4 8.9 9 11.6 5 7.4 10 10 12.4 6 16 7 14.6 00 8 13.2 9 11.6 10 12.4 (a) Make a scatterplot of the data in group A and find the OLS (least- squares) line for this data. Change the name of the sheet with your regression results to the Q3a sheet in the Exam Part 2 Template. Put the scatterplot and your regression results in a sheet/tab called Q3 graph and move it next to the results sheet. Write a brief description of the relationship between X and Y on the main Answer sheet in the Q3a space. (b) Repeat the steps in part (a) for group B, in the Q3b sheet, Q3 graph sheet, and Q3 space on the Answer sheet. (c) Make a scatterplot with all ten observations and find the OLS regression line. Create two more tabs/sheets called Q3 sheet, Q3 graph sheet. Compare your regression results from part (c) answer to what you found in (a) and (b) and explain in the main Answer page in the Template.
Step by Step Solution
There are 3 Steps involved in it

Get step-by-step solutions from verified subject matter experts