

Question: H 6 & 7 H6&7 The graph of the discrete probability to the right represents the number of live births by a mother 51 to
H 6 & 7
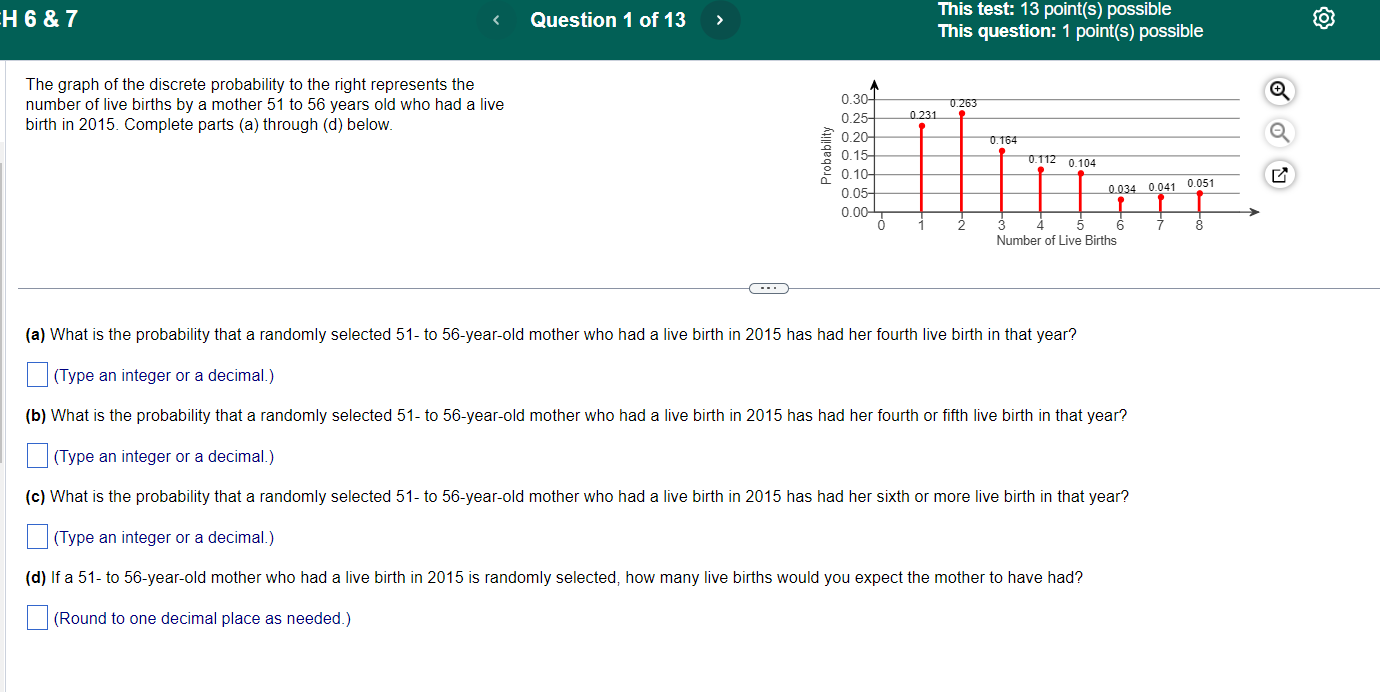
H6&7 The graph of the discrete probability to the right represents the number of live births by a mother 51 to 56 years old who had a live birth in 2015 Complete parts (a) through (d) below. Question 1 of 13 This test: 13 point(s) possible This question: 1 point(s) possible 0.3 0.2 0.2 0.1 0.1 2 0.104 3 4 5 6 Number of Live Births 0.041 7 0.051 8 (a) What is the probability that a randomly selected 51- to 56-year-old mother who had a live birth in 2015 has had her fourth live birth in that year? (Type an integer or a decimal.) (b) What is the probability that a randomly selected 51- to 56-year-old mother who had a live birth in 2015 has had her fourth or fifth live birth in that year? (Type an integer or a decimal.) (c) What is the probability that a randomly selected 51- to 56-year-old mother who had a live birth in 2015 has had her sixth or more live birth in that year? (Type an integer or a decimal.) (d) If a 51- to 56-year-old mother who had a live birth in 2015 is randomly selected; how many live births would you expect the mother to have had? (Round to one decimal place as needed.)
Step by Step Solution
There are 3 Steps involved in it

Get step-by-step solutions from verified subject matter experts