

Question: (H) interpret r2 (I) Find the linear model, y= ax+b (round a and b to one decimal) (J) use it to find the percent spent
(H) interpret r2 (I) Find the linear model, y= ax+b (round a and b to one decimal) (J) use it to find the percent spent on food if the family's income is 16.5 Please show all work
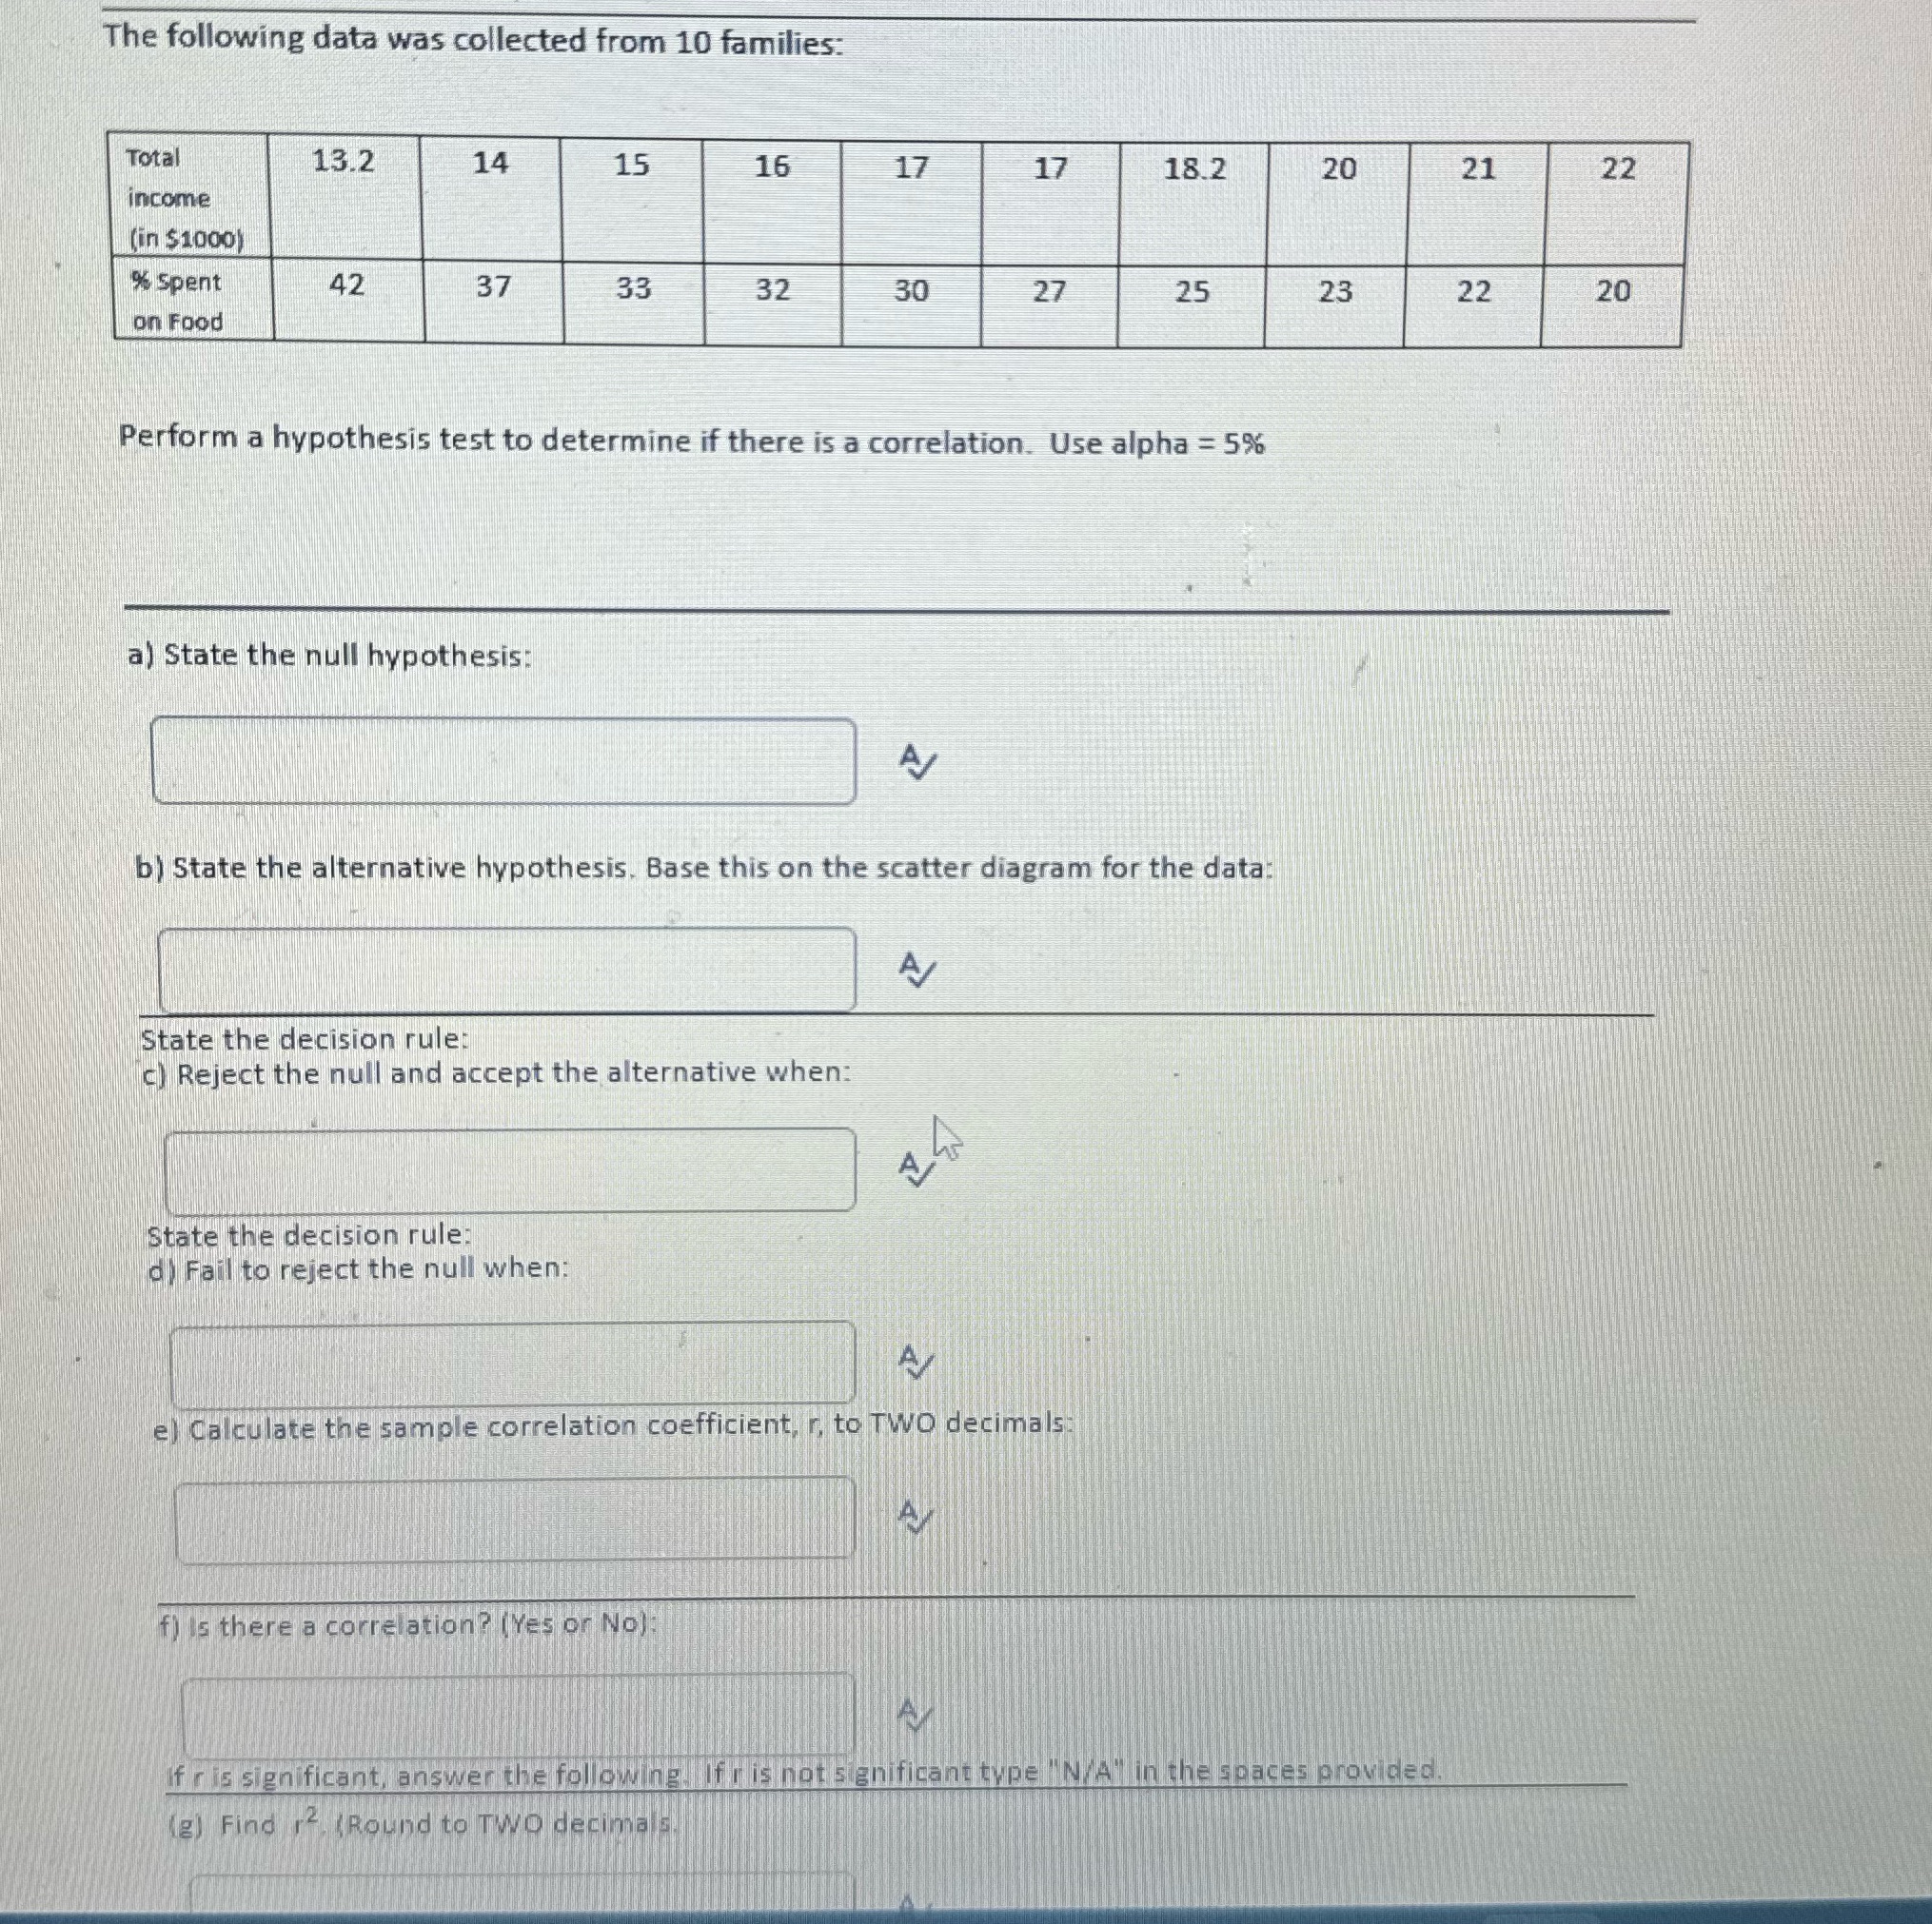
The following data was collected from 10 families: Total 13.2 14 15 16 17 17 18.2 20 21 22 income (in $1000 % Spent 42 37 33 32 30 27 25 23 22 20 on Food Perform a hypothesis test to determine if there is a correlation. Use alpha = 5% a) State the null hypothesis: b) State the alternative hypothesis. Base this on the scatter diagram for the data: A/ State the decision rule: c) Reject the null and accept the alternative when: State the decision rule: d) Fail to reject the null when: e) Calculate the sample correlation coefficient, r, to TWO decimals: () is there a correlation? (Yes or No) fris significant, answer the following. if r is not significant type "N/A" in the spaces provided. (2) Find 12, (Round to TWO decimals
Step by Step Solution
There are 3 Steps involved in it

Get step-by-step solutions from verified subject matter experts