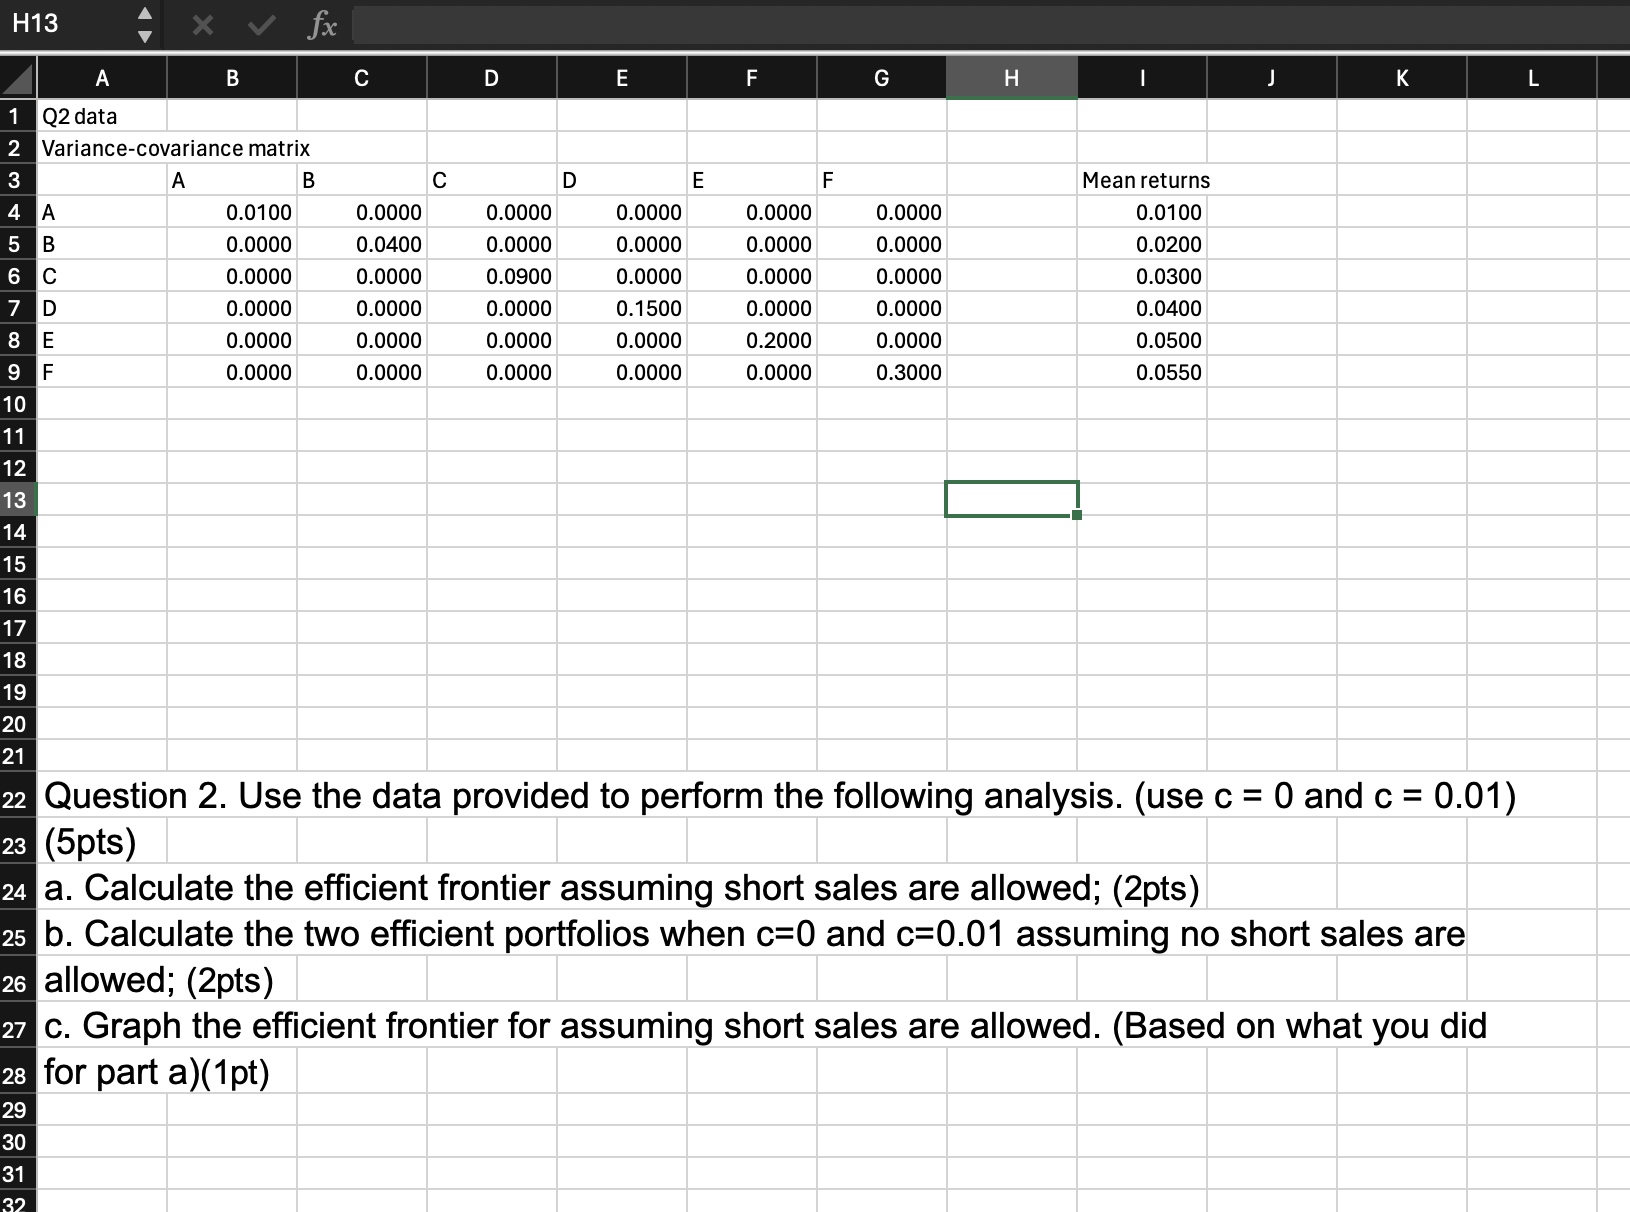
Question: H13 X v fx A B C D E F G H J K L 1 Q2 data 2 Variance-covariance matrix 3 A B C

H13 X v fx A B C D E F G H J K L 1 Q2 data 2
H13 X v fx A B C D E F G H J K L 1 Q2 data 2 Variance-covariance matrix 3 A B C D E F Mean returns 4 A 0.0100 0.0000 0.0000 0.0000 0.0000 0.0000 0.0100 5 B 0.0000 0.0400 0.0000 0.0000 0.0000 0.0000 0.0200 6 C 0.0000 0.0000 0.0900 0.0000 0.0000 0.0000 0.0300 D 0.0000 0.0000 0.0000 0. 1500 0.0000 0.0000 0.0400 8 E 0.0000 0.0000 0.0000 0.0000 0.2000 0.0000 0.0500 9 F 0.0000 0.0000 0.0000 0.0000 0.0000 0.3000 0.0550 10 12 CO JOU A W 19 Question 2. Use the data provided to perform the following analysis. (use c = 0 and c = 0.01) 23 (5pts) a. Calculate the efficient frontier assuming short sales are allowed; (2pts) b. Calculate the two efficient portfolios when c=0 and c=0.01 assuming no short sales are allowed; (2pts) 27 c. Graph the efficient frontier for assuming short sales are allowed. (Based on what you did 28 for part a) (1pt) 29 30 31

Step by Step Solution

There are 3 Steps involved in it

1 Expert Approved Answer
Step: 1 Unlock blur-text-image
Question Has Been Solved by an Expert!

Get step-by-step solutions from verified subject matter experts

Step: 2 Unlock
Step: 3 Unlock

Students Have Also Explored These Related Finance Questions!