

Question: H21 X D E B C ROOT LTD. INCOME STATEMENT FOR THE YEAR ENDED DECEMBER 31, 2021 CANADIAN DOLLARS (millions of dollars) S 1,332 476
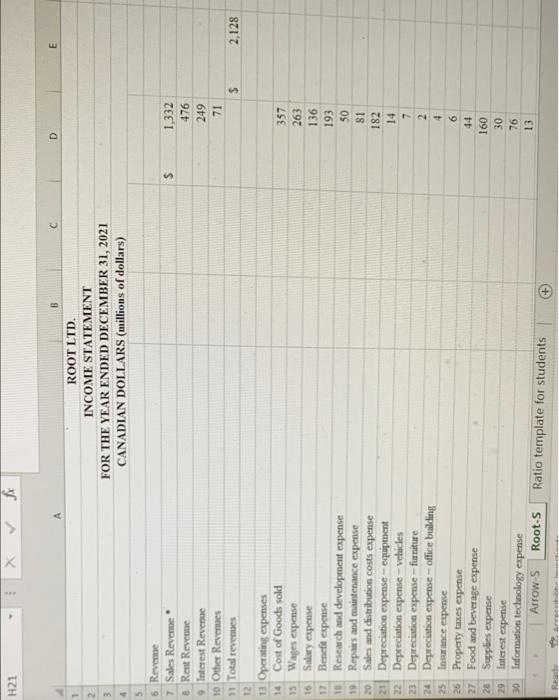
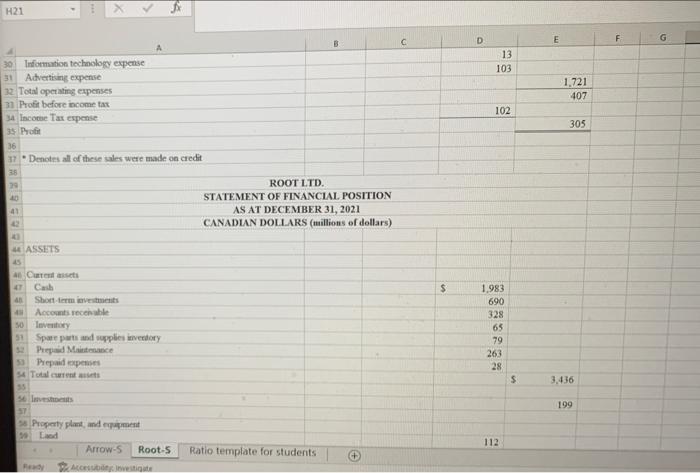
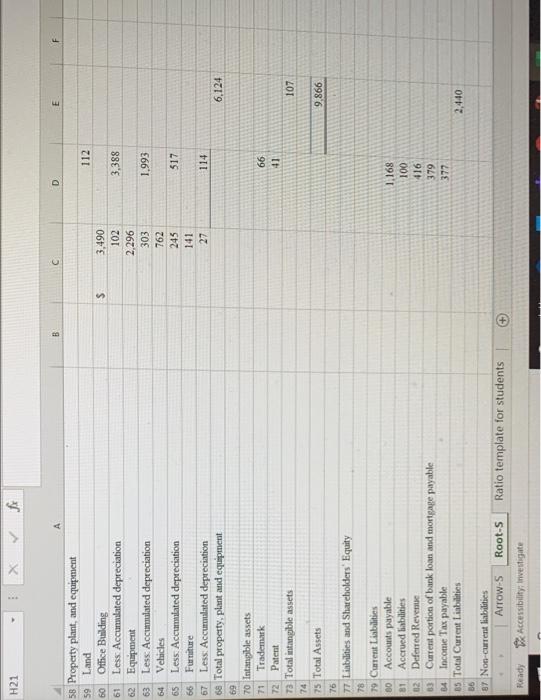
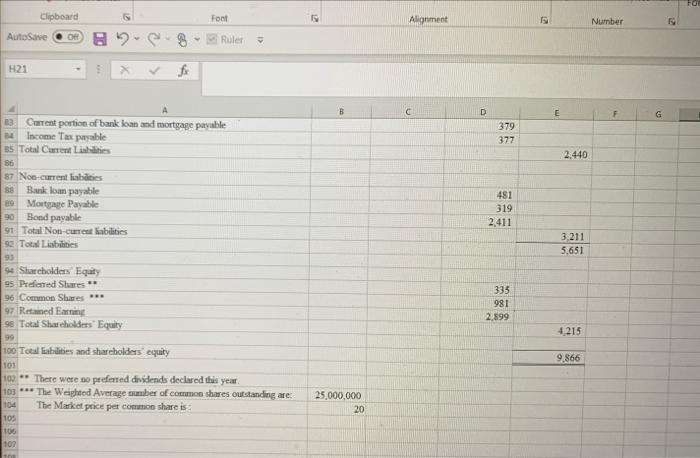
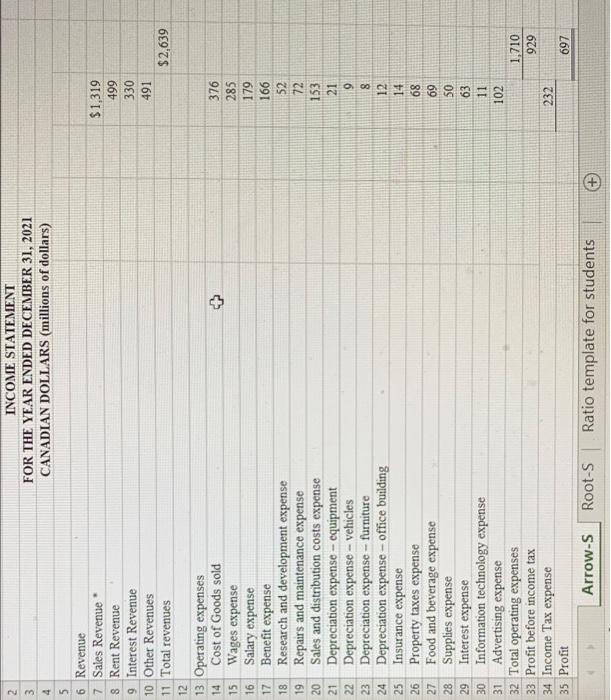
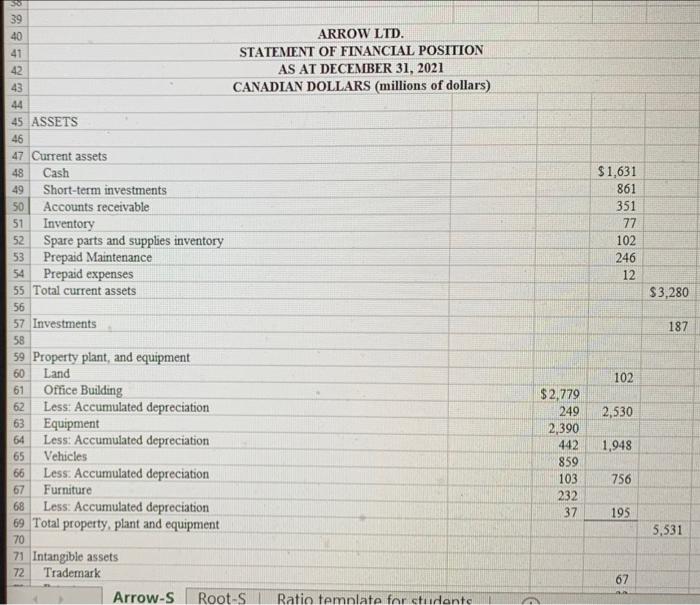
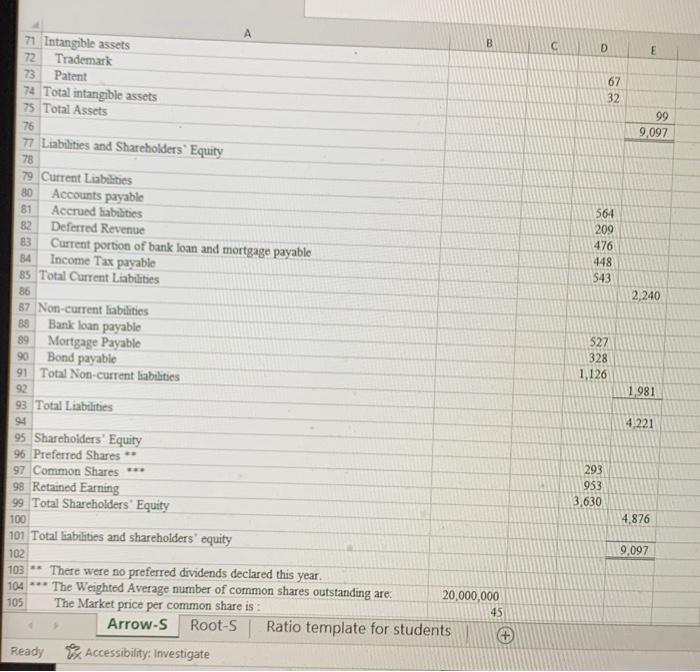
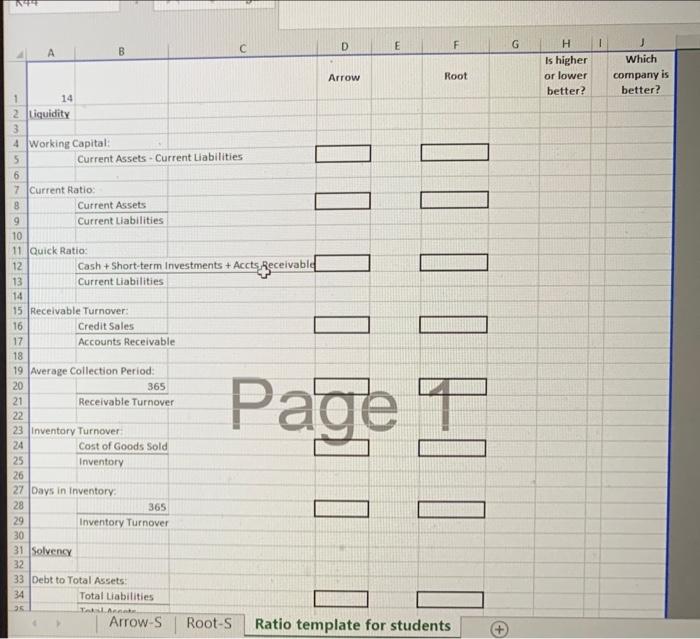
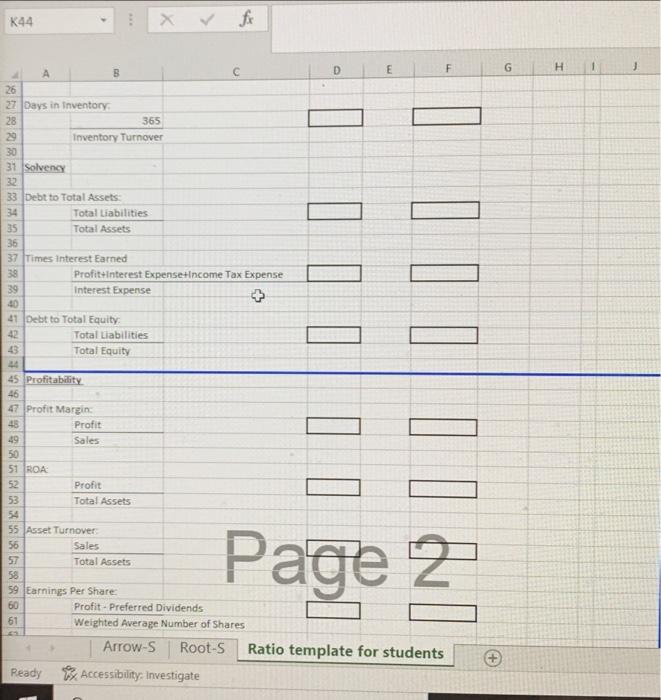
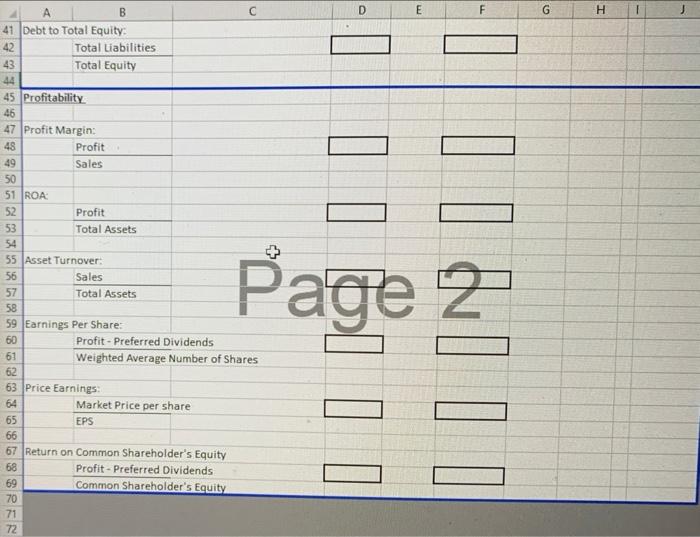
H21 X D E B C ROOT LTD. INCOME STATEMENT FOR THE YEAR ENDED DECEMBER 31, 2021 CANADIAN DOLLARS (millions of dollars) S 1,332 476 249 71 $ S 2,128 6 Revenge 7 Sales Revenue Rent Revenge Interest Revenue 10 Other Revenues 11 Total revenues 12 13 Operating expenses 14 Cost of Goods sold 15 Wages expense 16 Salary expense 17 Benefit expense 10 Research and development expense 19 Repairs and maintenance expense Sales and distribution costs expense 21 Depreciation expense - equipment 22 Depreciation expense - vehicles 23 Depreciation expense -- furniture 24 Depreciation expense-office building 25 Insurance expense 26 Property taxes expense 27 Food and beverage expense 20 Supplies expense 29 Interest expense 30 Information technology expense Arrow-S Root-s 357 263 136 193 50 81 182 14 7 2 4 6 160 30 76 13 Ratio template for students H21 D B E F G 13 103 1,721 407 102 305 30 Information technology expense 31 Advertising expense 2 Total operating expenses 31 Profit before income tax 34 Income Tax expense 35 Prati 36 17 Denots all of these sales were made on credit 35 29 ROOT LTD STATEMENT OF FINANCIAL POSITION 40 AS AT DECEMBER 31, 2021 CANADIAN DOLLARS (millions of dollars) ASSETS 1.983 690 328 A Cares 41 Cash Short-term investments Accounts recebe 50 Inventory 51 Spare parts and supplies investory 52 Prepaid Malance 59 Prepaid expenses 4 Totalcars 35 56 lavet 65 79 263 28 $ 3,436 199 - Property plant and met Led Arrow-5 Root-5 Mette 112 Ratio template for students H21 > f D E 112 $ 61 3,388 3,490 102 2,296 303 762 245 141 27 63 64 1.993 15 517 66 67 114 58 Property plant, and equipment 59 Land 60 Office Building Less Accumulated depreciation 62 Equipment Less: Accumulated depreciation Vehicles Less. Accumulated depreciation Furniture Less Accumulated depreciation 68 Total property, plant and equipment 69 70 Intangible assets 71 Trademark 72 Patent 73 Total intangible assets 74 75 Total Assets 76 77 Liabilities and Shareholders' Equity 6,124 66 41 107 9,866 79 Current Liabilities 00 Accounts payable 81 Accrued liabilities 02 Deferred Revente 83 Current portion of bank loan and mortgage payable 14 Income Tax payable 05 Total Current Liabilities 06 87 Non-current liabilities Arrow-S Root-s Ratio template for students Ready Accessibility: Investigate 1,168 100 416 379 377 2,440 Clipboard Font Alignment Number F AutoSave ON Ruler H21 D E F G 379 377 2.440 13 Current portion of bank loan and mortgage payable Income Tax payable BS Total Current Landlities 86 87 Nos current liabilities BE Bank loan payable Mortgage Payable 90 Bond payable 91 Total Non-current abilities 92 Total Liabilities 481 319 2,411 3.211 5,651 335 981 2,599 4,215 54 Shareholders' Equity 9 Preened Shares ** 96 Common Shares 97 Retained Eag 98 Total Shareholders Equity 99 100 Toalishlities and shareholders equity 103 102** There were no preferred dividends declared this year 103 The Weighted Average mamber of common shares outstanding are 104 The Market price per common share is TOS 106 107 9.866 25,000,000 20 ON $1,319 499 330 491 $ 2,639 2 INCOME STATEMENT 3 FOR THE YEAR ENDED DECEMBER 31, 2021 4 CANADIAN DOLLARS (millions of dollars) 5 6 Revenue 7 Sales Revenue 8 Rent Revenue 9 Interest Revenue 10 Other Revenues 11 Total revenues 12 13 Operating expenses 14 Cost of Goods sold 15 Wages expense 16 Salary expense 17 Benefit expense 18 Research and development expense 19 Repairs and maintenance expense 20 Sales and distribution costs expense 21 Depreciation expense - equipment 22 Depreciation expense - vehicles 23 Depreciation expense - furniture 24 Depreciation expense - office building 25 Insurance expense 26 Property taxes expense 27 Food and beverage expense 28 Supplies expense 29 Interest expense 30 Information technology expense 31 Advertising expense 32 Total operating expenses 33 Profit before income tax 34 Income Tax expense 35 Profit Arrow-S Root-S Ratio template for students 376 285 179 166 52 72 153 21 9 8 12 14 68 69 50 63 11 102 1,710 929 232 697 + $1,631 861 351 77 102 246 12. $3,280 39 40 ARROW LTD. 41 STATEMENT OF FINANCIAL POSITION 42 AS AT DECEMBER 31, 2021 43 CANADIAN DOLLARS (millions of dollars) 44 45 ASSETS 46 47 Current assets 48 Cash 49 Short-term investments 50 Accounts receivable 51 Inventory 52 Spare parts and supplies inventory 53 Prepaid Maintenance 54 Prepaid expenses 55 Total current assets 56 57 Investments 58 59 Property plant, and equipment 60 Land 61 Office Building 62 Less: Accumulated depreciation 63 Equipment 64 Less: Accumulated depreciation 65 Vehicles 66 Less: Accumulated depreciation 67 Furniture 68 Less: Accumulated depreciation 69 Total property, plant and equipment 70 71 Intangible assets 72 Trademark Arrow-S Root-S Ratio temnlate for studente 187 102 2,530 1,948 $2.779 249 2,390 442 859 103 232 37 756 195 5,531 67 A B D E 67 32 99 9,097 564 209 476 448 543 2,240 71 Intangible assets 72 Trademark 73 Patent 74 Total intangible assets 75 Total Assets 76 77 Liabilities and Shareholders' Equity 78 79 Current Liabilities 80 Accounts payable 81 Accrued abilities 82 Deferred Revenue 83 Current portion of bank loan and mortgage payablo 34 Income Tax payable 85 Total Current Liabilities 86 87 Non-current liabilities 88 Bank loan payable 89 Mortgage Payable 90 Bond payable 91 Total Non-current liabilities 92 93 Total Liabilities 24 95 Shareholders' Equity 96 Preferred Shares ** 97 Common Shares *** 98 Retained Earning 99 Total Shareholders' Equity 100 101 Total liabilities and shareholders' equity 102 103 - There were no preferred dividends declared this year. 104 *** The Weighted Average number of common shares outstanding are. 20,000,000 105 The Market price per common share is 45 Arrow-s Root-s Ratio template for students Ready Accessibility: Investigate $27 328 1,126 1.981 4.221 293 953 3.630 4,876 9,097 D E F G 1 B H Is higher or lower better? Arrow Root Which company is better? - P! 14 2 liquidity 3 4 Working Capital Current Assets. Current Liabilities 6 7 Current Ratio: 8 Current Assets 9 Current Liabilities 10 11 Quick Ratio: 12 Cash + Short-term Investments + Accts Receivable + 13 Current Liabilities 14 15 Receivable Turnover 16 Credit Sales 17 Accounts Receivable 18 19 Average Collection Periodi 20 365 21 Receivable Turnover 22 23 inventory Turnover 24 Cast of Goods Sold 25 Inventory 26 27 Days in Inventory 28 365 29 Inventory Turnover 30 31 Solvency 32 33 Debt to Total Assets 34 Total Liabilities 35 Arrow-S Root-s Ratio template for students Page 7 TALA K44 fr G H 1 D E F A 26 27 Days in Inventory 28 365 29 Inventory Turnover 30 31 Solvency 22 33 Debt to Total Assets 34 Total Liabilities 35 Total Assets 36 37 Times interest Earned 38 Profit-interest Expense+income Tax Expense 39 Interest Expense + 40 41 Debt to Total Equity 42 Total Liabilities 43 Total Equity 44 45 Profitability 46 47 Profit Margin: 45 Profit 49 Sales 50 51 ROA 52 Profit 53 Total Assets 54 55 Asset Turnover 56 Sales 57 Total Assets 58 59 Earnings Per Share 60 Profit - Preferred Dividends 61 Weighted Average Number of Shares Arrow-S Root-S Ratio template for students Ready Accessibility: Investigate 8888%%%% A B x 8 %n%8mm Page 2 2 D E F G H I B 41 Debt to Total Equity 42 Total Liabilities 43 Total Equity 44 45 Profitability 47 Profit Margin: 48 Profit 49 Sales 50 51 ROA 52 Profit 53 Total Assets 54 55 Asset Turnover: 56 Sales 57 Total Assets 58 59 Earnings Per Share: Profit - Preferred Dividends Weighted Average Number of Shares 62 63 Price Earnings Market Price per share EPS 66 67 Return on Common Shareholder's Equity 68 Profit - Preferred Dividends 69 Common Shareholder's Equity 70 N888 989898989898 Page 2 Il 72
Step by Step Solution
There are 3 Steps involved in it

Get step-by-step solutions from verified subject matter experts