

Question: H28 X. fx A B C D E F Financial Statement Data 1 2 3 4 5 6 7 8 9 10 11 12 13
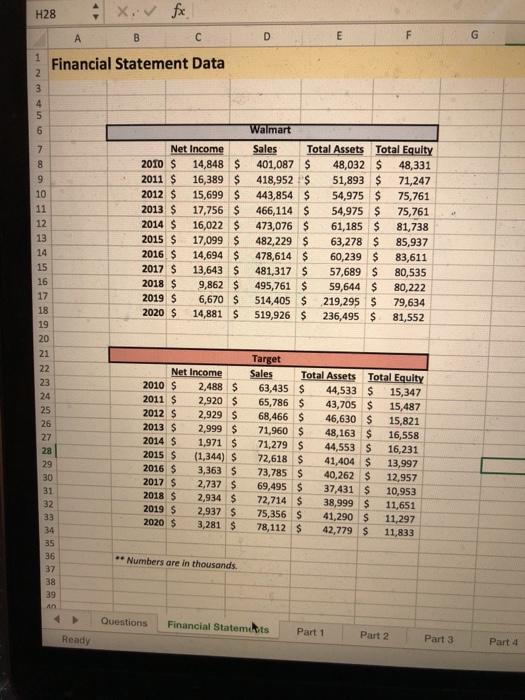
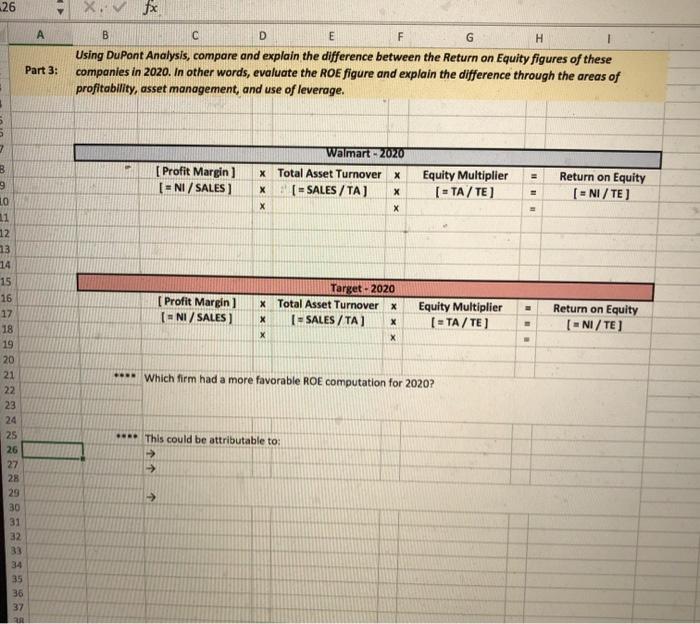
H28 X. fx A B C D E F Financial Statement Data 1 2 3 4 5 6 7 8 9 10 11 12 13 14 Walmart Net Income Sales Total Assets Total Equity 2010 $ 14,848 $ 401,087 S 48,032 $ 48,331 2011 $ 16,389 $ 418,952 $ 51,893 $ 71,247 2012 $ 15,699 $ 443,854 $ 54,975 $ 75,761 2013 S 17,756 $ 466,114 S 54,975 $ 75,761 2014 $ 16,022 $ 473,076 $ 61,185 $ 81,738 2015 $ 17,099 $ 482,229 $ 63,278 $ 85,937 2016 $ 14,694 $ 478,614 $ 60,239 $ 83,611 2017 S 13,643 $ 481,317 S 57,689 $ 80,535 2018 $ 9,862 $ 495,761 $ 59,644 $ 80,222 2019 $ 6,670 $ 514,405 $ 219,295 $ 79,634 2020 $ 14,881 $ 519,926 $ 236,495 $ 81,552 15 16 17 18 19 20 21 22 23 24 25 26 Net Income 2010 $ 2,488 $ 2011 S 2,920 $ 2012 $ 2,929 $ 2013 S 2,999 $ 2014 $ 1,971 $ 2015 $ (1,344) $ 2016 $ 3,363 S 2017 $ 2,737 2018 $ 2,934 $ 2019 $ 2,937 $ 2020 $ 3,281 $ Target Sales Total Assets Total Equity 63,435 $ 44,533 $ 15,347 65,786 $ 43,705 $ 15,487 68,466 $ 46,630 $ 15,821 71,960 $ 48,163 $ 16,558 71,279 $ 44,553 S 16,231 72,618 $ 41,404 $ 13,997 73,785 $ 40,262 $ 12,957 69,495 $ 37,431 $ 10,953 72,714 $ 38,999 $ 11,651 75,356 $ 41,290 $ 11,297 78,112 $ 42,779 $ 11,833 28 29 30 31 32 33 34 35 36 37 38 39 ** Numbers are in thousands Questions Financial Statemets Part 1 Ready Part 2 Part 3 Part 4 - 26 fx A B C D E F G H Using DuPont Analysis, compare and explain the difference between the Return on Equity figures of these companies in 2020. In other words, evaluate the ROE figure and explain the difference through the areas of profitability, asset management, and use of leverage. Part 3: 5 7 [ Profit Margin ) (=NI / SALES ] Walmart 2020 X Total Asset Turnover X X [ SALES /TA) Equity Multiplier [ = TA/TE] Return on Equity [ = NI / TE] [Profit Margin ] [ - NI/ SALES) Target - 2020 * Total Asset Turnover X I - SALES /TA) X X X Equity Multiplier [ = TA/TE) Return on Equity (=NI/TE) B 9 10 11 12 13 14 15 16 17 18 19 20 21 22 23 24 25 26 27 28 29 30 31 32 33 34 35 **". Which firm had a more favorable ROE computation for 2020? *** This could be attributable to: > > 36 37 2
Step by Step Solution
There are 3 Steps involved in it

Get step-by-step solutions from verified subject matter experts