

Question: Hand in: Use the data in the Excel spread sheet named Chapter 1 Data. This contains carbon emissions per capita for 50 selected countries (taken
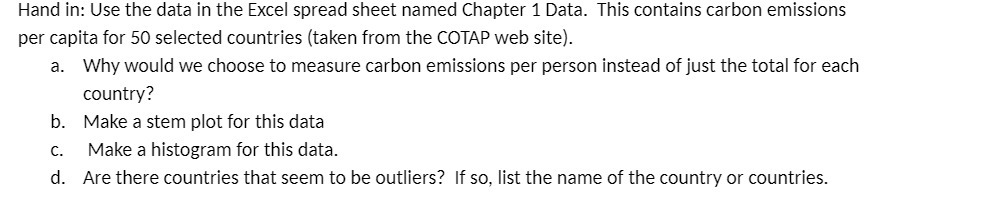
Hand in: Use the data in the Excel spread sheet named Chapter 1 Data. This contains carbon emissions per capita for 50 selected countries (taken from the COTAP web site]. a. Why would we choose to measure carbon emissions per person instead of just the total for each country? 13. Make a stem plot for this data c. Make a histogram for this data. (:1. Are there countries that seem to be outliers? If so, list the name of the country or countries
Step by Step Solution
There are 3 Steps involved in it
1 Expert Approved Answer
Step: 1 Unlock

Question Has Been Solved by an Expert!
Get step-by-step solutions from verified subject matter experts
Step: 2 Unlock
Step: 3 Unlock