

Question: Hello, i need help with the attached excel sheet and questions. thank you. Ch. 1 Hand in Homework Use the data in the Excel spread


Hello, i need help with the attached excel sheet and questions. thank you.
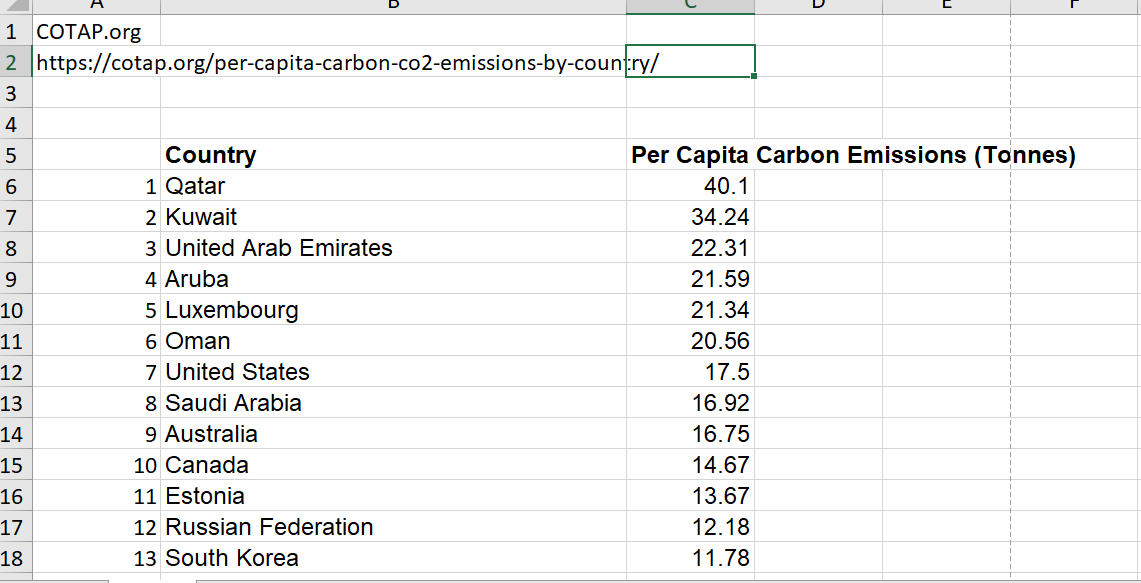

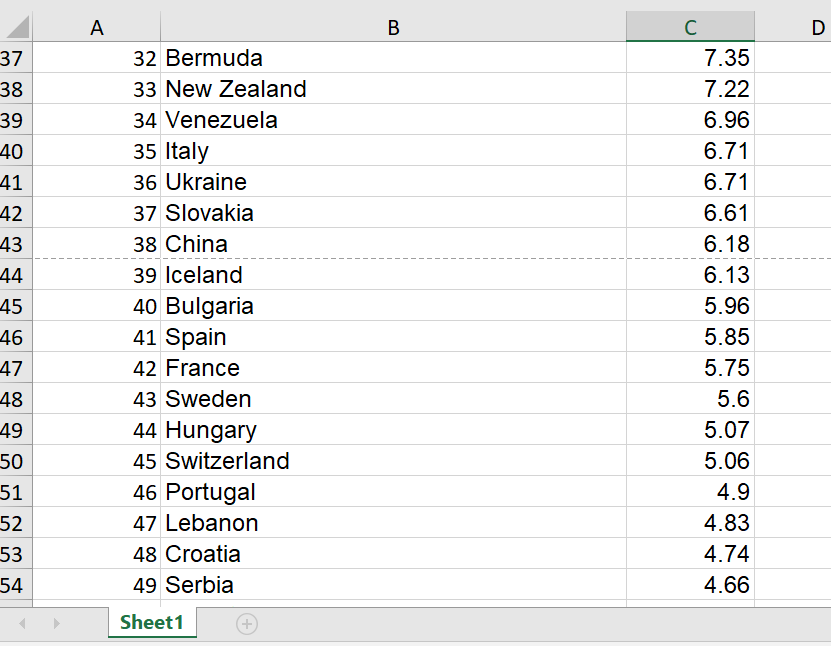
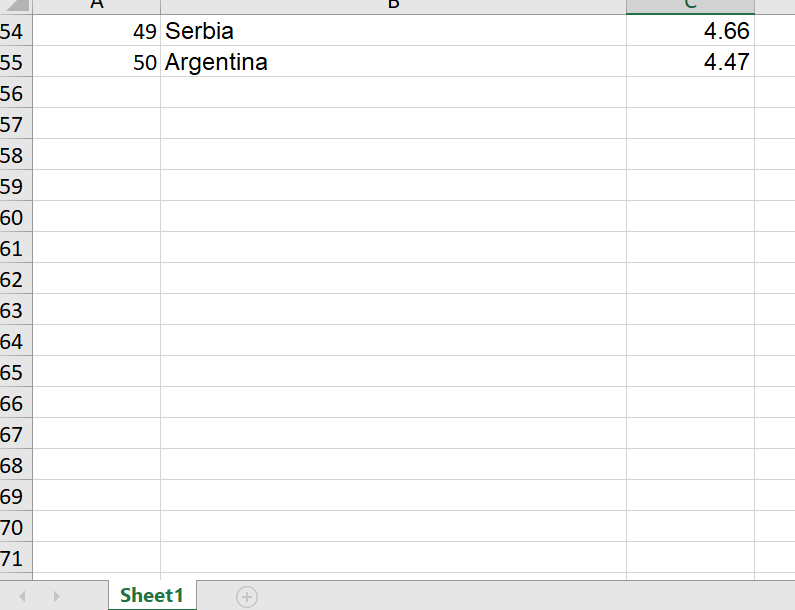
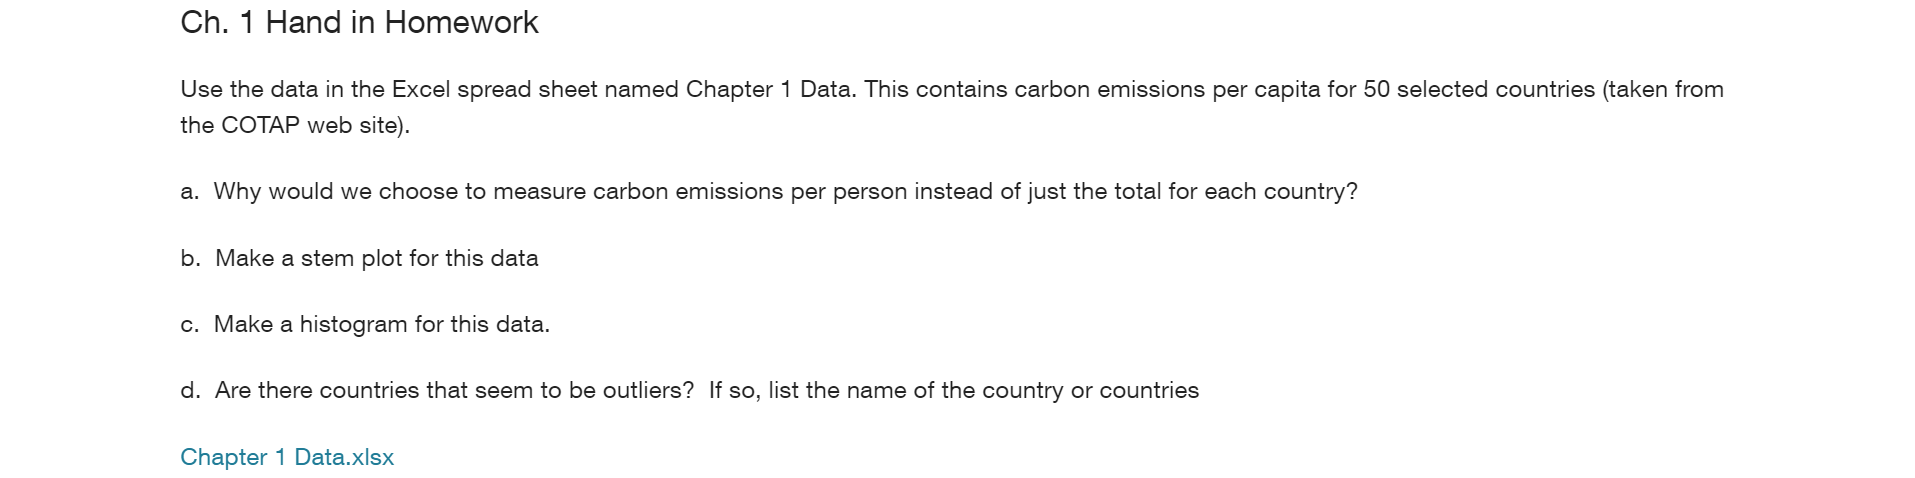
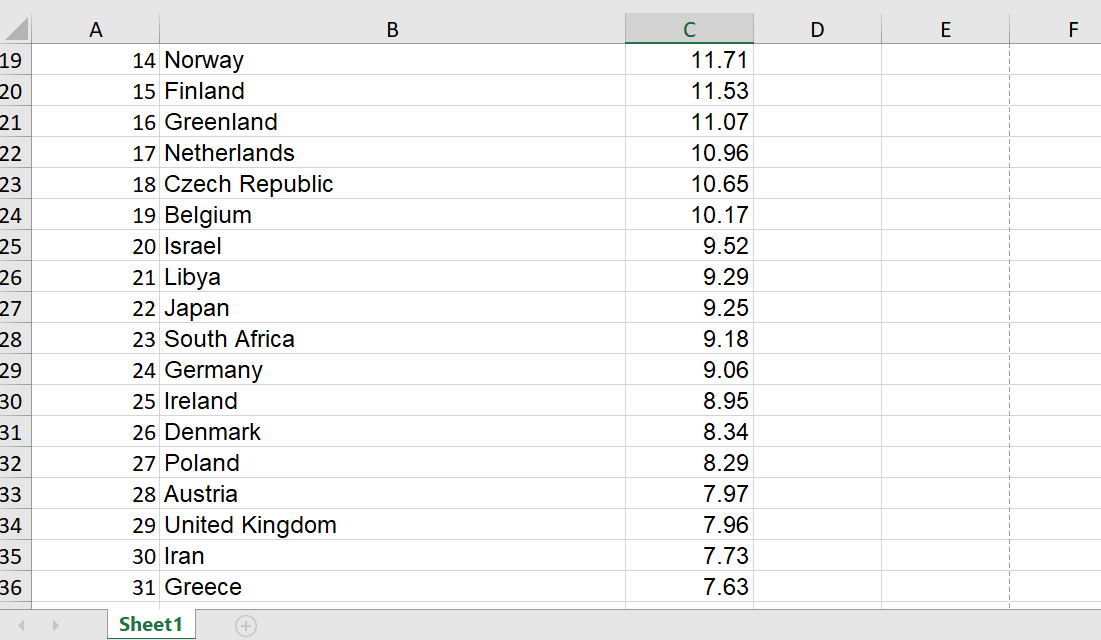
Ch. 1 Hand in Homework Use the data in the Excel spread sheet named Chapter 1 Data. This contains carbon emissions per capital for 50 selected countries (taken from the COTAP web site). a. Why would we choose to measure carbon emissions per person instead of just the total for each country? b. Make a stem plot for this data c. Make a histogram for this data. d. Are there countries that seem to be outliers? If so, list the name of the country or countries Chapter 1 Data.xlsx
Step by Step Solution
There are 3 Steps involved in it
1 Expert Approved Answer
Step: 1 Unlock

Question Has Been Solved by an Expert!
Get step-by-step solutions from verified subject matter experts
Step: 2 Unlock
Step: 3 Unlock