

Hansson needs to evaluate a potential expansion opportunity. You (done individually), as a special consulting team...
Fantastic news! We've Found the answer you've been seeking!
Question:
Transcribed Image Text:
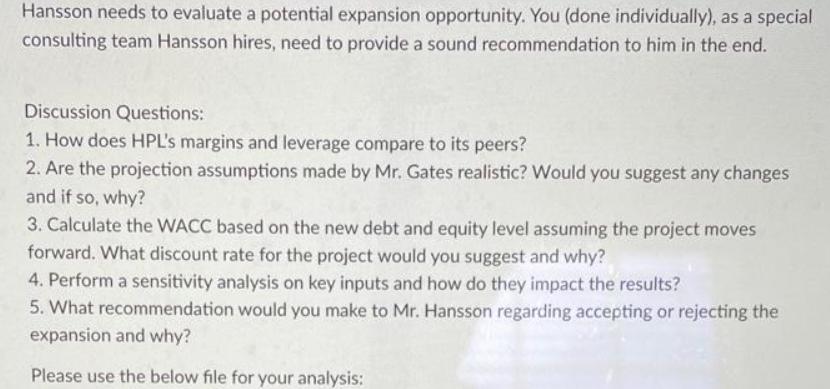
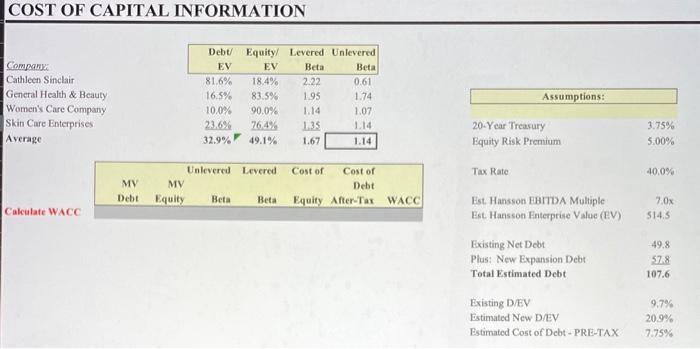
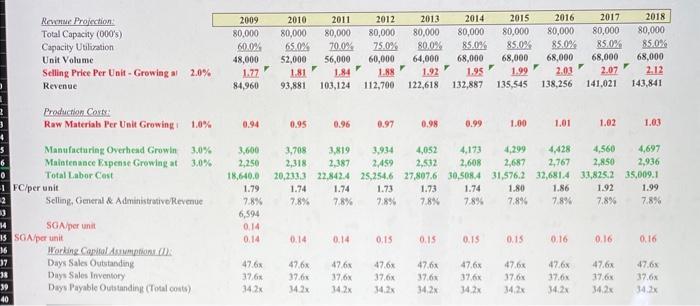
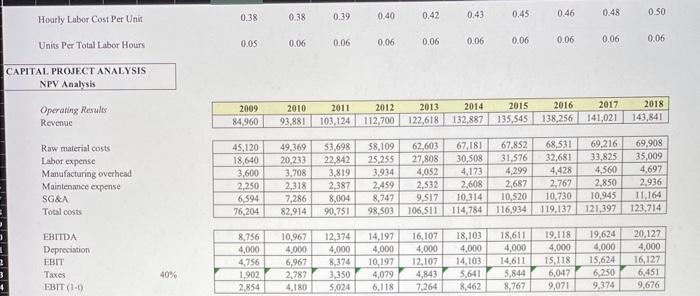
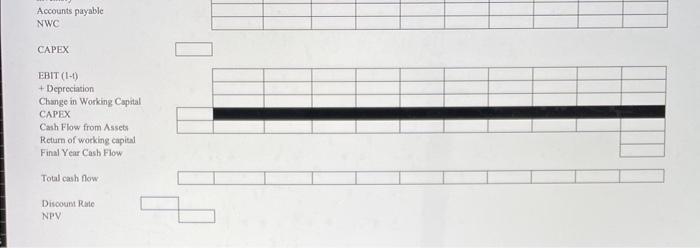
Hansson needs to evaluate a potential expansion opportunity. You (done individually), as a special consulting team Hansson hires, need to provide a sound recommendation to him in the end. Discussion Questions: 1. How does HPL's margins and leverage compare to its peers? 2. Are the projection assumptions made by Mr. Gates realistic? Would you suggest any changes and if so, why? 3. Calculate the WACC based on the new debt and equity level assuming the project moves forward. What discount rate for the project would you suggest and why? 4. Perform a sensitivity analysis on key inputs and how do they impact the results? 5. What recommendation would you make to Mr. Hansson regarding accepting or rejecting the expansion and why? Please use the below file for your analysis: COST OF CAPITAL INFORMATION Company Cathleen Sinclair General Health & Beauty Women's Care Company Skin Care Enterprises Average Calculate WACC Debt EV 81.6% 16.5% 10.0% 23.6% 32.9% Unlevered MV MV Debt Equity Beta Equity/ Levered Unlevered EV Beta 18.4% 83.5% 90.0% 76.4% 49.1% Leveredi 2.22 1.95 1.14 1.35 1.67 Cost of Beta 0.61 1.74 1.07 1.14 1.14 Cost of Debt Beta Equity After-Tax WACC Assumptions: 20-Year Treasury Equity Risk Premium Tax Rate Est. Hansson EBITDA Multiple Est. Hansson Enterprise Value (EV) Existing Net Debt Plus: New Expansion Debt Total Estimated Debt Existing D/EV Estimated New D/EV Estimated Cost of Debt-PRE-TAX 3.75% 5.00% 40.0% 7,0x 514.5 49.8 57.8 107.6 9.7% 20.9% 7.75% 5 Revenue Projection Total Capacity (000's) Capacity Utilization Unit Volume Selling Price Per Unit - Growing al 2.0% Revenue 37 Production Contr Raw Materials Per Unit Growing 6 0 1 FC/per unit 12 38 39 40 1.0% Manufacturing Overhead Growin 3.0% Maintenance Expense Growing at 3.0% Total Labor Cost 13 114 15 SGA/per unit 16 Selling, General & Administrative Revenue SGA/per unit Working Capital Assumptions (D Days Sales Outstanding Days Sales Inventory Days Payable Outstanding (Total costs) 2009 2010 80,000 80,000 60.0% 65.0% 52,000 48,000 1.77 84,960 3,600 2,250 18,640.0 1.79 7.8% 6,594 0.14 0.14 47.6x 37,6x 34.2x 1.81 1.84 93,881 103,124 0.95 1.74 7.8% 2011 2012 2013 2014 2015 2016 2017 2018 80,000 80,000 80,000 80,000 80,000 80,000 80,000 80,000 85.0% 85.0% 85.0% 85.0% 85.0% 70.0% 75.0% 80.0% 56,000 60,000 64,000 68,000 68,000 68,000 68,000 68,000 1.88 1.92 1.95 2.12 1.99 2.03 2.07 112,700 122,618 132,887 135,545 138,256 141,021 143,841 7 ▼ 0.14 47,6x 37.6x 34.2x 0.96 0.97 1.74 1.73 7.8% 7.8% 0.14 47,6x 37,6x 34.2x 3,708 3,819 3,934 4,428 4,560 4,697 4,052 4,173 4,299 2,532 2,608 2,687 2,767 2,850 2,318 2,387 2,459 2,936 20,233.3 22,842.4 25,254,6 27,807.6 30,508,4 31,576.2 32,681.4 33,825.2 35,009.1 0.15 0.98 47.6x 37,6x 34.2x 1.73 7.8% 0.15 0.99 47.6x 37.6x 34,2x 1.74 7.8% 1.00 0.15 1.80 7.8% 0.15 1.01 47.6x 47.6x 37,6x 37.6x 34,2x 34,2x F 0.16 1.02 1.86 1.92 7.8% 7.8% 47.6x 37.6x 34,2x 0.16 1.03 47.6x 37.6x 34,2x 1.99 7.8% 0.16 47.6x 37.6x 34.2x Hourly Labor Cost Per Unit Units Per Total Labor Hours CAPITAL PROJECT ANALYSIS NPV Analysis Operating Results Revenue Raw material costs Labor expense Manufacturing overhead Maintenance expense SG&A Total costs EBITDA Depreciation EBIT Taxes EBIT (1-0) 40% 0.38 0,05 2009 84,960 6,594 76,204 0.38 8,756 4,000 4,756 0.06 2010 93,881 45,120 49,369 18,640 3,600 2,250 0.39 10,967 4,000 6,967 1,902 2,787 2,854 0.06 53,698 22,842 20,233 3,708 3,819 2,318 2,387 7,286 82,914 2011 2012 103,124 112,700 8,004 90,751 0.40 0.06 3,350 4,180 5,024 0.42 0.06 2013 122,618 4,079 6,118 3,934 4,052 2,459 8,747 98,503 0.43 12,374 14,197 4,000 4,000 4,000 8,374 10,197 12,107 0.06 58,109 62,603 67,181 25,255 27,808 0.45 2014 2015 132,887 135,545 2,532 2,608 9,517 106,511 114,784 0.06 0.46 0.06 68,531 67,852 32,681 31,576 4,428 30,508 4,173 4,299 2,687 10,314 10,520 10,730 2,767 16,107 18,103 18,611 4,000 4,000 14,103 4,843 5,641 7,264 8,462 2016 138,256 0.48 0.06 2017 141,021 69,216 33,825 4,560 2,850 10,945 116,934 119,137 121,397 19,118 19,624 4,000 4,000 14,611 15,118 15,624 5,844 6,047 6,250 8,767 9,071 9,374 0.50 0.06 2018 143,841 69,908 35,009 4,697 2,936 11,164 123,714 20,127 4,000 16,127 6,451 9,676 Accounts payable NWC CAPEX EBIT (1-1) + Depreciation Change in Working Capital CAPEX Cash Flow from Assets Return of working capital Final Year Cash Flow Total cash flow Discount Rate NPV Hansson needs to evaluate a potential expansion opportunity. You (done individually), as a special consulting team Hansson hires, need to provide a sound recommendation to him in the end. Discussion Questions: 1. How does HPL's margins and leverage compare to its peers? 2. Are the projection assumptions made by Mr. Gates realistic? Would you suggest any changes and if so, why? 3. Calculate the WACC based on the new debt and equity level assuming the project moves forward. What discount rate for the project would you suggest and why? 4. Perform a sensitivity analysis on key inputs and how do they impact the results? 5. What recommendation would you make to Mr. Hansson regarding accepting or rejecting the expansion and why? Please use the below file for your analysis: COST OF CAPITAL INFORMATION Company Cathleen Sinclair General Health & Beauty Women's Care Company Skin Care Enterprises Average Calculate WACC Debt EV 81.6% 16.5% 10.0% 23.6% 32.9% Unlevered MV MV Debt Equity Beta Equity/ Levered Unlevered EV Beta 18.4% 83.5% 90.0% 76.4% 49.1% Leveredi 2.22 1.95 1.14 1.35 1.67 Cost of Beta 0.61 1.74 1.07 1.14 1.14 Cost of Debt Beta Equity After-Tax WACC Assumptions: 20-Year Treasury Equity Risk Premium Tax Rate Est. Hansson EBITDA Multiple Est. Hansson Enterprise Value (EV) Existing Net Debt Plus: New Expansion Debt Total Estimated Debt Existing D/EV Estimated New D/EV Estimated Cost of Debt-PRE-TAX 3.75% 5.00% 40.0% 7,0x 514.5 49.8 57.8 107.6 9.7% 20.9% 7.75% 5 Revenue Projection Total Capacity (000's) Capacity Utilization Unit Volume Selling Price Per Unit - Growing al 2.0% Revenue 37 Production Contr Raw Materials Per Unit Growing 6 0 1 FC/per unit 12 38 39 40 1.0% Manufacturing Overhead Growin 3.0% Maintenance Expense Growing at 3.0% Total Labor Cost 13 114 15 SGA/per unit 16 Selling, General & Administrative Revenue SGA/per unit Working Capital Assumptions (D Days Sales Outstanding Days Sales Inventory Days Payable Outstanding (Total costs) 2009 2010 80,000 80,000 60.0% 65.0% 52,000 48,000 1.77 84,960 3,600 2,250 18,640.0 1.79 7.8% 6,594 0.14 0.14 47.6x 37,6x 34.2x 1.81 1.84 93,881 103,124 0.95 1.74 7.8% 2011 2012 2013 2014 2015 2016 2017 2018 80,000 80,000 80,000 80,000 80,000 80,000 80,000 80,000 85.0% 85.0% 85.0% 85.0% 85.0% 70.0% 75.0% 80.0% 56,000 60,000 64,000 68,000 68,000 68,000 68,000 68,000 1.88 1.92 1.95 2.12 1.99 2.03 2.07 112,700 122,618 132,887 135,545 138,256 141,021 143,841 7 ▼ 0.14 47,6x 37.6x 34.2x 0.96 0.97 1.74 1.73 7.8% 7.8% 0.14 47,6x 37,6x 34.2x 3,708 3,819 3,934 4,428 4,560 4,697 4,052 4,173 4,299 2,532 2,608 2,687 2,767 2,850 2,318 2,387 2,459 2,936 20,233.3 22,842.4 25,254,6 27,807.6 30,508,4 31,576.2 32,681.4 33,825.2 35,009.1 0.15 0.98 47.6x 37,6x 34.2x 1.73 7.8% 0.15 0.99 47.6x 37.6x 34,2x 1.74 7.8% 1.00 0.15 1.80 7.8% 0.15 1.01 47.6x 47.6x 37,6x 37.6x 34,2x 34,2x F 0.16 1.02 1.86 1.92 7.8% 7.8% 47.6x 37.6x 34,2x 0.16 1.03 47.6x 37.6x 34,2x 1.99 7.8% 0.16 47.6x 37.6x 34.2x Hourly Labor Cost Per Unit Units Per Total Labor Hours CAPITAL PROJECT ANALYSIS NPV Analysis Operating Results Revenue Raw material costs Labor expense Manufacturing overhead Maintenance expense SG&A Total costs EBITDA Depreciation EBIT Taxes EBIT (1-0) 40% 0.38 0,05 2009 84,960 6,594 76,204 0.38 8,756 4,000 4,756 0.06 2010 93,881 45,120 49,369 18,640 3,600 2,250 0.39 10,967 4,000 6,967 1,902 2,787 2,854 0.06 53,698 22,842 20,233 3,708 3,819 2,318 2,387 7,286 82,914 2011 2012 103,124 112,700 8,004 90,751 0.40 0.06 3,350 4,180 5,024 0.42 0.06 2013 122,618 4,079 6,118 3,934 4,052 2,459 8,747 98,503 0.43 12,374 14,197 4,000 4,000 4,000 8,374 10,197 12,107 0.06 58,109 62,603 67,181 25,255 27,808 0.45 2014 2015 132,887 135,545 2,532 2,608 9,517 106,511 114,784 0.06 0.46 0.06 68,531 67,852 32,681 31,576 4,428 30,508 4,173 4,299 2,687 10,314 10,520 10,730 2,767 16,107 18,103 18,611 4,000 4,000 14,103 4,843 5,641 7,264 8,462 2016 138,256 0.48 0.06 2017 141,021 69,216 33,825 4,560 2,850 10,945 116,934 119,137 121,397 19,118 19,624 4,000 4,000 14,611 15,118 15,624 5,844 6,047 6,250 8,767 9,071 9,374 0.50 0.06 2018 143,841 69,908 35,009 4,697 2,936 11,164 123,714 20,127 4,000 16,127 6,451 9,676 Accounts payable NWC CAPEX EBIT (1-1) + Depreciation Change in Working Capital CAPEX Cash Flow from Assets Return of working capital Final Year Cash Flow Total cash flow Discount Rate NPV
Expert Answer:
Answer rating: 100% (QA)
ANSWER To provide a sound recommendation to Mr Hansson regarding the potential expansion opportunity lets address the discussion questions one by one 1 Comparison of HPLs margins and leverage to its p... View the full answer

Related Book For 
Management Accounting
ISBN: 9780730369387
4th Edition
Authors: Leslie G. Eldenburg, Albie Brooks, Judy Oliver, Gillian Vesty, Rodney Dormer, Vijaya Murthy, Nick Pawsey
Posted Date:
Students also viewed these finance questions
-
Managing Scope Changes Case Study Scope changes on a project can occur regardless of how well the project is planned or executed. Scope changes can be the result of something that was omitted during...
-
Read the case study "Southwest Airlines," found in Part 2 of your textbook. Review the "Guide to Case Analysis" found on pp. CA1 - CA11 of your textbook. (This guide follows the last case in the...
-
List three specific parts of the Case Guide, Objectives and Strategy Section (See below) that you had the most difficulty understanding. Describe your current understanding of these parts. Provide...
-
Discuss the ways that managed care organizations can infl uence the adoption of new technologies.
-
What is the value at the end of Year 3 of the following cash flow stream if the quoted interest rate is 10%, compoundedsemiannually? 3 Years 100 100 100
-
King Arthur\'s knights fire a cannon from the top of the castle wall. The cannonball is fired at a speed of 4 0 m / s and an angle of 3 7 /deg . A cannonball that was accidentally dropped hits the...
-
Find the fundamental frequency for torsional vibration of a shaft of length \(2 \mathrm{~m}\) and diameter \(50 \mathrm{~mm}\) when both the ends are fixed. The density of the material is \(7800...
-
A nutrition plan app has a subscription that costs $10/month. The following chart gives average historical renewal rates for subscribers based on how many months they have been a subscriber. Month 1...
-
Two solenoids stand side-by-side. Solenoid B differs from solenoid A in three respects. Its total current is 4 times as great, it has 8 times as many coils, and it is 6 times as long. How do the...
-
Tucker, Inc., produces high-quality suits and sport coats for men. Each suit requires 1.2 hours of cutting time and 0.7 hours of sewing time, uses 6 yards of material, and provides a profit...
-
5 of estion SECTION C: CASE STUDY Clara, who has been with ACE LTD for five years as a Project Manager, finds herself facing a new challenge. She's been appointed as the leader for a project with a...
-
Explain the level of control an employer must retain for the worker to be considered an employee and not an independent contractor.
-
____________ ____________ statutes make the owner of a vehicle liable for the negligence of anyone using their car with their permission.
-
What is the doctrine of respondeat superior, and what is its rationale?
-
True Or False An employer who hires an independent contractor but who retains control over any part of the work can be held liable for the negligence of that contractor.
-
What criteria are used to distinguish an employee from an independent contractor? a. What is the significance of this difference? b. Under what conditions can an employer be held liable for the...
-
McKelvie Opto Products manufactures and sells blurry eye charts for the "less-than-honest" optometrist. Each eye chart sells for $16.00. Variable costs per eye chart are $6.00. Fixed costs per year...
-
Show that, given a maximum flow in a network with m edges, a minimum cut of N can be computed in O(m) time.
-
Explain how cost data is sourced in a costing framework.
-
Each of the costs below is incurred by Fairgood & Hernandez, a small CPA firm. Required Identify whether each of the following costs most likely relates to an (i) organisation sustaining activity,...
-
SmallScale Publishing has just commenced business and will sell only one title, New to Business. Market analysis has indicated that sales for the next 6 months should be 5 000 copies. The accountant...
-
An analysis by Professor Peter M Rothwell and his colleagues (Nuffield Department of Clinical Neuroscience, University of Oxford, UK) published in 2012 in the medical journal The Lancet...
-
Suppose a student is interested in knowing the preferred holiday destinations of the faculty members in their university. They are affiliated to the college of business and interview a few of the...
-
The following table shows the result of the 2018 General Elections in Pakistan, along with the vote share predicted by several organizations in the days before the elections. The sample sizes were...

Study smarter with the SolutionInn App