

The following table shows the result of the 2018 General Elections in Pakistan, along with the vote
Question:
The following table shows the result of the 2018 General Elections in Pakistan, along with the vote share predicted by several organizations in the days before the elections. The sample sizes were typically above 2,000 people, and the reported margin of error was around plus or minus 2 percentage points. (The percentages for each poll do not sum up to 100 because of the vote share of other regional parties in a democratic setup.)
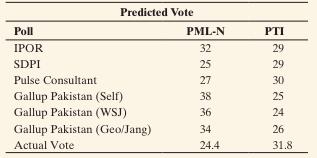
a. The SDPI Poll Predicted that 29% were going to vote for PTI, with a margin of error of 2 percentage points.
Explain what that means.
b. Do most of the predictions fall within 2% (the margin of error) of the actual vote percentages? Considering the relative sizes of the sample, the population, and the other parties factor, would you say that these polls have good accuracy?
c. Access the Sampling Distribution for the Sample Proportion web app at www.ArtofStat.com, and set the population proportion to 32% (the actual vote share of PTI rounded to two significant digits) and the sample size to 3,000 (a typical sample size for the polls shown here). Press the Generate Sample(s) button 10 times to stimulate taking a poll of 3,000 voters 10 times. The bottom graph now marks 10 potential results obtained from exit polls of 3,000 voters under this scenario. You can see the smallest and the largest value of these 10 proportions by checking the “Summary Statistics for Sample Distribution” box under Options.
What are the smallest and the largest proportions you obtained in your simulation of 10 exit points?
Step by Step Answer:

This question has not been answered yet.
You can Ask your question!

Statistics The Art And Science Of Learning From Data
ISBN: 9781292444765
5th Global Edition
Authors: Alan Agresti, Christine A. Franklin, Bernhard Klingenberg
