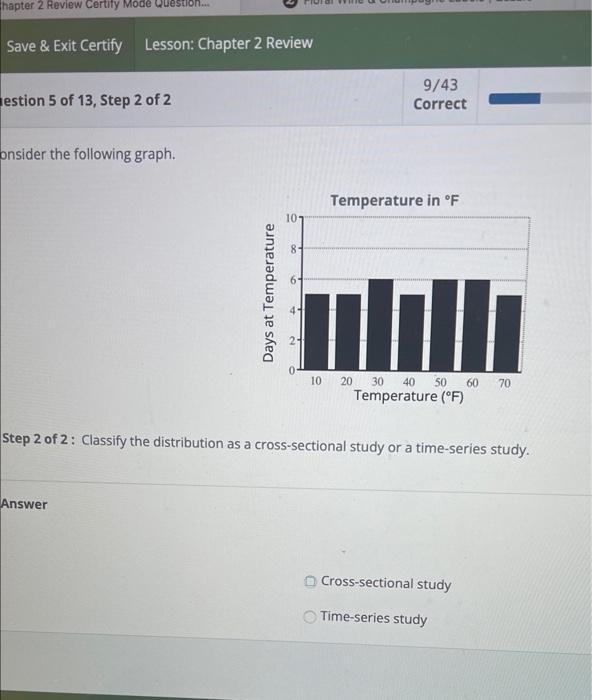
Question: hapter 2 Review Certity Mode Question... Save & Exit Certify Lesson: Chapter 2 Review estion 5 of 13, Step 2 of 2 9/43 Correct onsider

hapter 2 Review Certity Mode Question... Save &
hapter 2 Review Certity Mode Question... Save & Exit Certify Lesson: Chapter 2 Review estion 5 of 13, Step 2 of 2 9/43 Correct onsider the following graph. Temperature in F 10 Days at Temperature 10 70 20 30 40 50 60 Temperature (F) Step 2 of 2: Classify the distribution as a cross-sectional study or a time-series study. Answer Cross-sectional study Time-series study

Step by Step Solution

There are 3 Steps involved in it

1 Expert Approved Answer
Step: 1 Unlock blur-text-image
Question Has Been Solved by an Expert!

Get step-by-step solutions from verified subject matter experts

Step: 2 Unlock
Step: 3 Unlock

Students Have Also Explored These Related General Management Questions!