

Question: Have to fill out the first table using mixed strategy. The first question mark the answer is 13 by doing 78/6. Submit for Extra credit
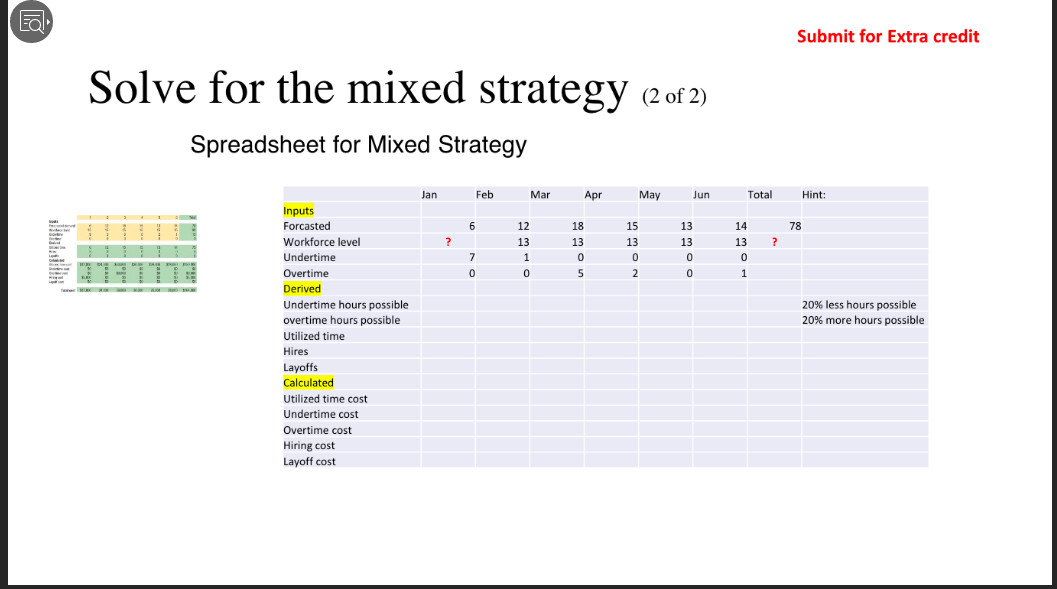
Have to fill out the first table using mixed strategy. The first question mark the answer is 13 by doing 78/6.
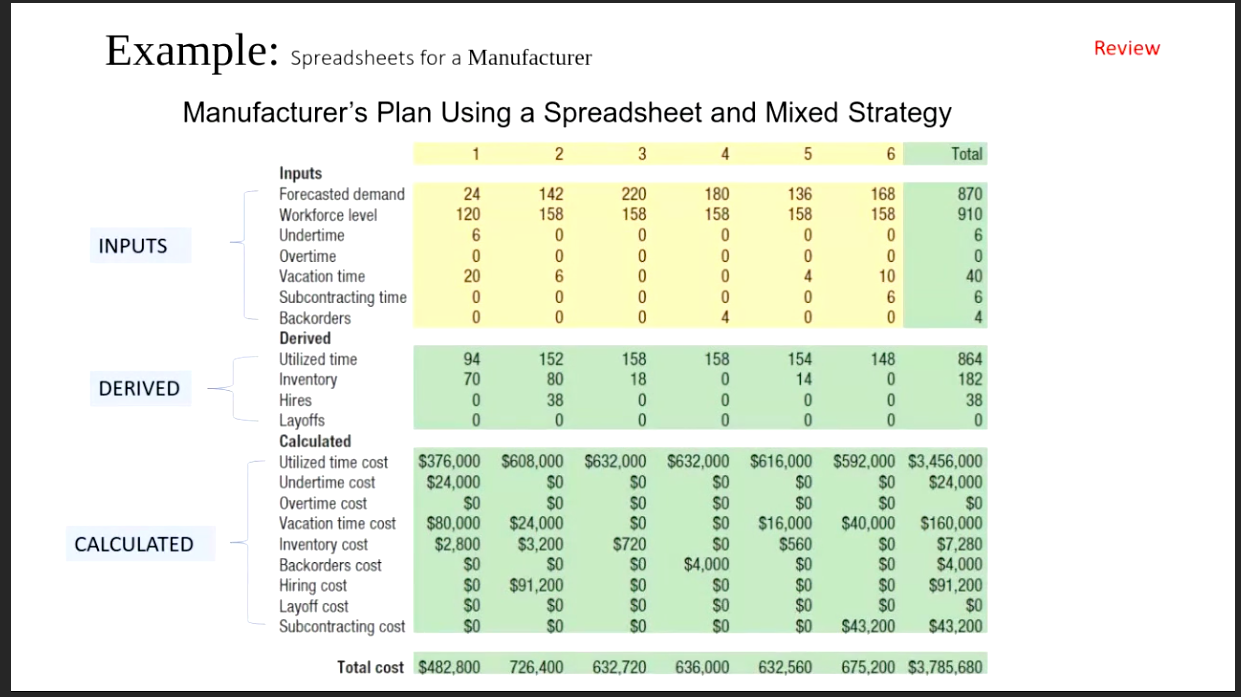
Submit for Extra credit Solve for the mixed strategy (2of 2) Spreadsheet for Mixed Strategy Jan Feb Mar Apr May Jun Total Hint: 1 6 78 ? 12 13 1 0 18 13 0 5 15 13 0 2 13 13 0 0 14 13 0 1 ? 7 0 Inputs Forcasted Workforce level Undertime Overtime Derived Undertime hours possible overtime hours possible Utilized time Hires 20% less hours possible 20% more hours possible Layoffs Calculated Utilized time cost Undertime cost Overtime cost Hiring cost Layoff cost Review Spreadsheets for a Manufacturer Manufacturer's Plan Using a Spreadsheet and Mixed Strategy 2 3 4 5 6 Total 870 142 158 220 158 0 180 158 0 136 158 120 168 158 910 INPUTS 0 0 O 158 158 154 148 864 DERIVED Inputs Forecasted demand Workforce level Undertime Overtime Vacation time Subcontracting time Backorders Derived Utilized time Inventory Hires Layoffs Calculated Utilized time cost Undertime cost Overtime cost Vacation time cost Inventory cost Backorders cost Hiring cost Layoff cost Subcontracting cost 0 $376,000 $24,000 $608,000 $632,000 $616,000 SO $632,000 $0 $0 SO $0 $0 $0 CALCULATED $80,000 $2,800 $0 $24,000 $3,200 SO $91,200 $0 $0 $0 $4.000 $16,000 $560 $720 $592,000 $3,456,000 $0 $24,000 $0 $0 $40,000 $160,000 $7,280 $0 $4,000 $91,200 $0 $43,200 $43,200 SO $0 $0 $0 SO $0 SO SO $0 $0 Total cost $482,800 726,400 632,720 636,000 632,560 675,200 $3,785,680 Submit for Extra credit Solve for the mixed strategy (2of 2) Spreadsheet for Mixed Strategy Jan Feb Mar Apr May Jun Total Hint: 1 6 78 ? 12 13 1 0 18 13 0 5 15 13 0 2 13 13 0 0 14 13 0 1 ? 7 0 Inputs Forcasted Workforce level Undertime Overtime Derived Undertime hours possible overtime hours possible Utilized time Hires 20% less hours possible 20% more hours possible Layoffs Calculated Utilized time cost Undertime cost Overtime cost Hiring cost Layoff cost Review Spreadsheets for a Manufacturer Manufacturer's Plan Using a Spreadsheet and Mixed Strategy 2 3 4 5 6 Total 870 142 158 220 158 0 180 158 0 136 158 120 168 158 910 INPUTS 0 0 O 158 158 154 148 864 DERIVED Inputs Forecasted demand Workforce level Undertime Overtime Vacation time Subcontracting time Backorders Derived Utilized time Inventory Hires Layoffs Calculated Utilized time cost Undertime cost Overtime cost Vacation time cost Inventory cost Backorders cost Hiring cost Layoff cost Subcontracting cost 0 $376,000 $24,000 $608,000 $632,000 $616,000 SO $632,000 $0 $0 SO $0 $0 $0 CALCULATED $80,000 $2,800 $0 $24,000 $3,200 SO $91,200 $0 $0 $0 $4.000 $16,000 $560 $720 $592,000 $3,456,000 $0 $24,000 $0 $0 $40,000 $160,000 $7,280 $0 $4,000 $91,200 $0 $43,200 $43,200 SO $0 $0 $0 SO $0 SO SO $0 $0 Total cost $482,800 726,400 632,720 636,000 632,560 675,200 $3,785,680Step by Step Solution
There are 3 Steps involved in it
1 Expert Approved Answer
Step: 1 Unlock

Question Has Been Solved by an Expert!
Get step-by-step solutions from verified subject matter experts
Step: 2 Unlock
Step: 3 Unlock