

Question: Having issues anseweing page 1 and 2 b. (10 pts.) Here are the graphical results of the Insurance Market experiment. How do these results relate
Having issues anseweing page 1 and 2
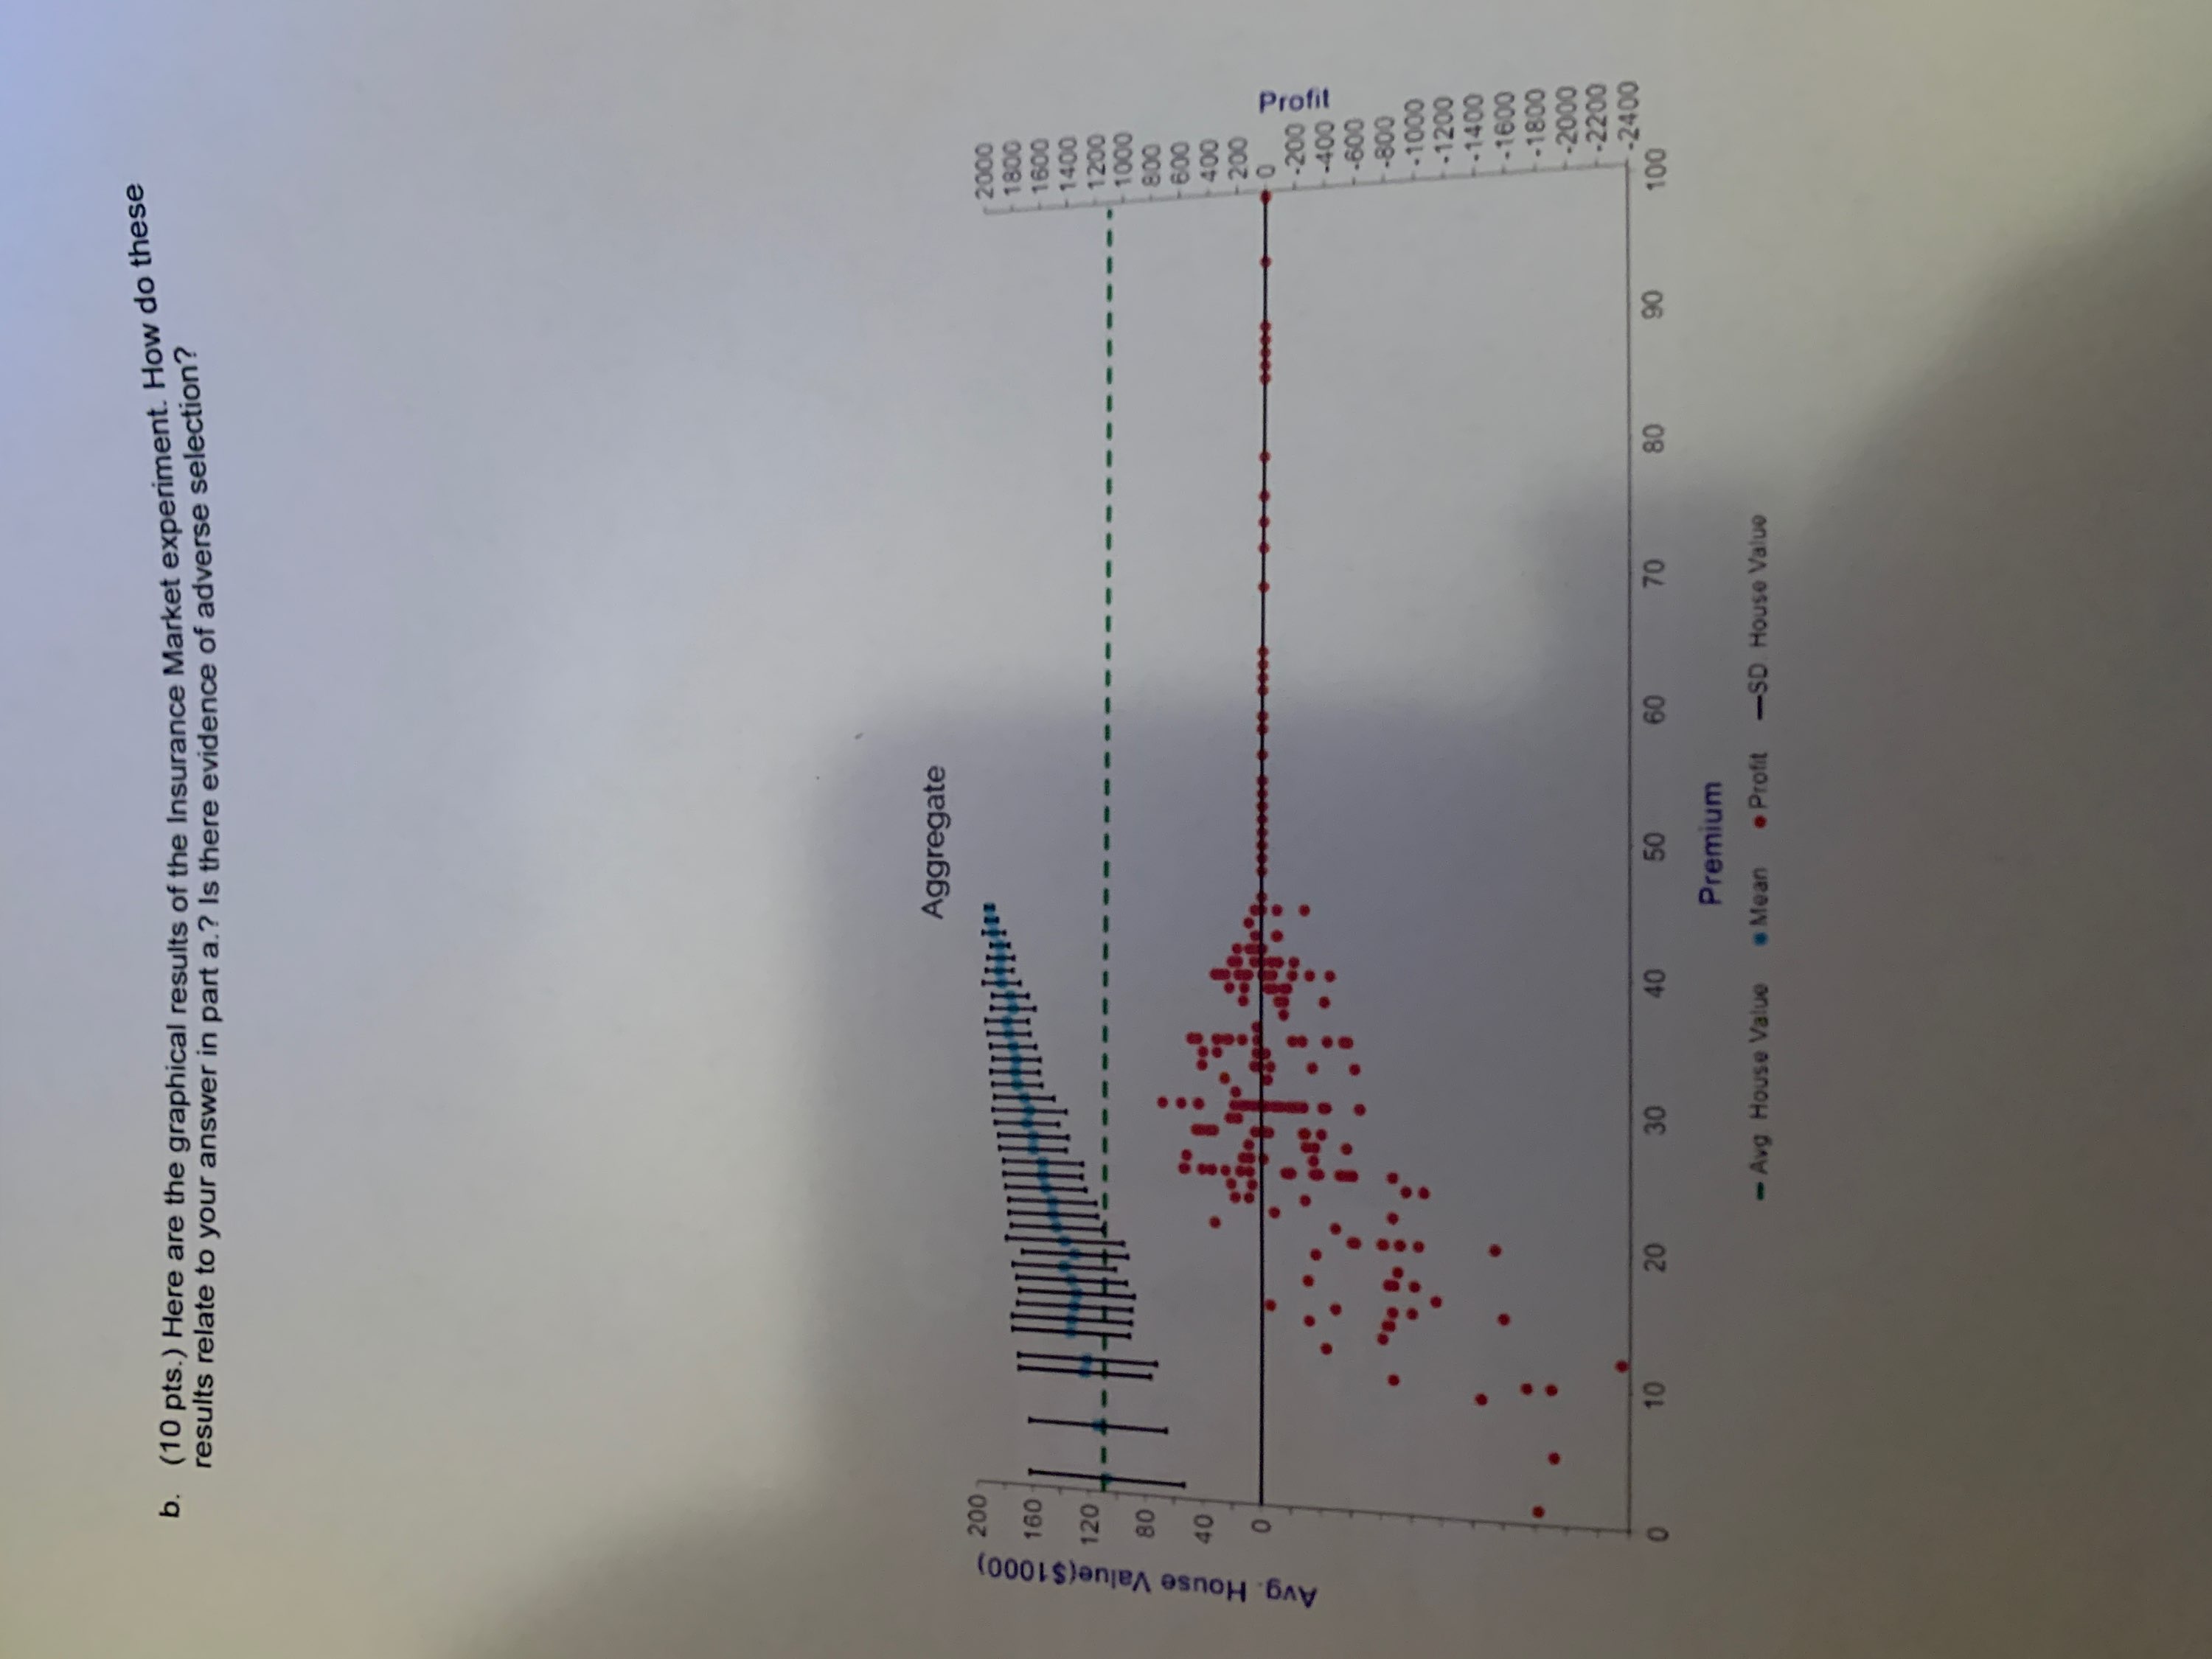
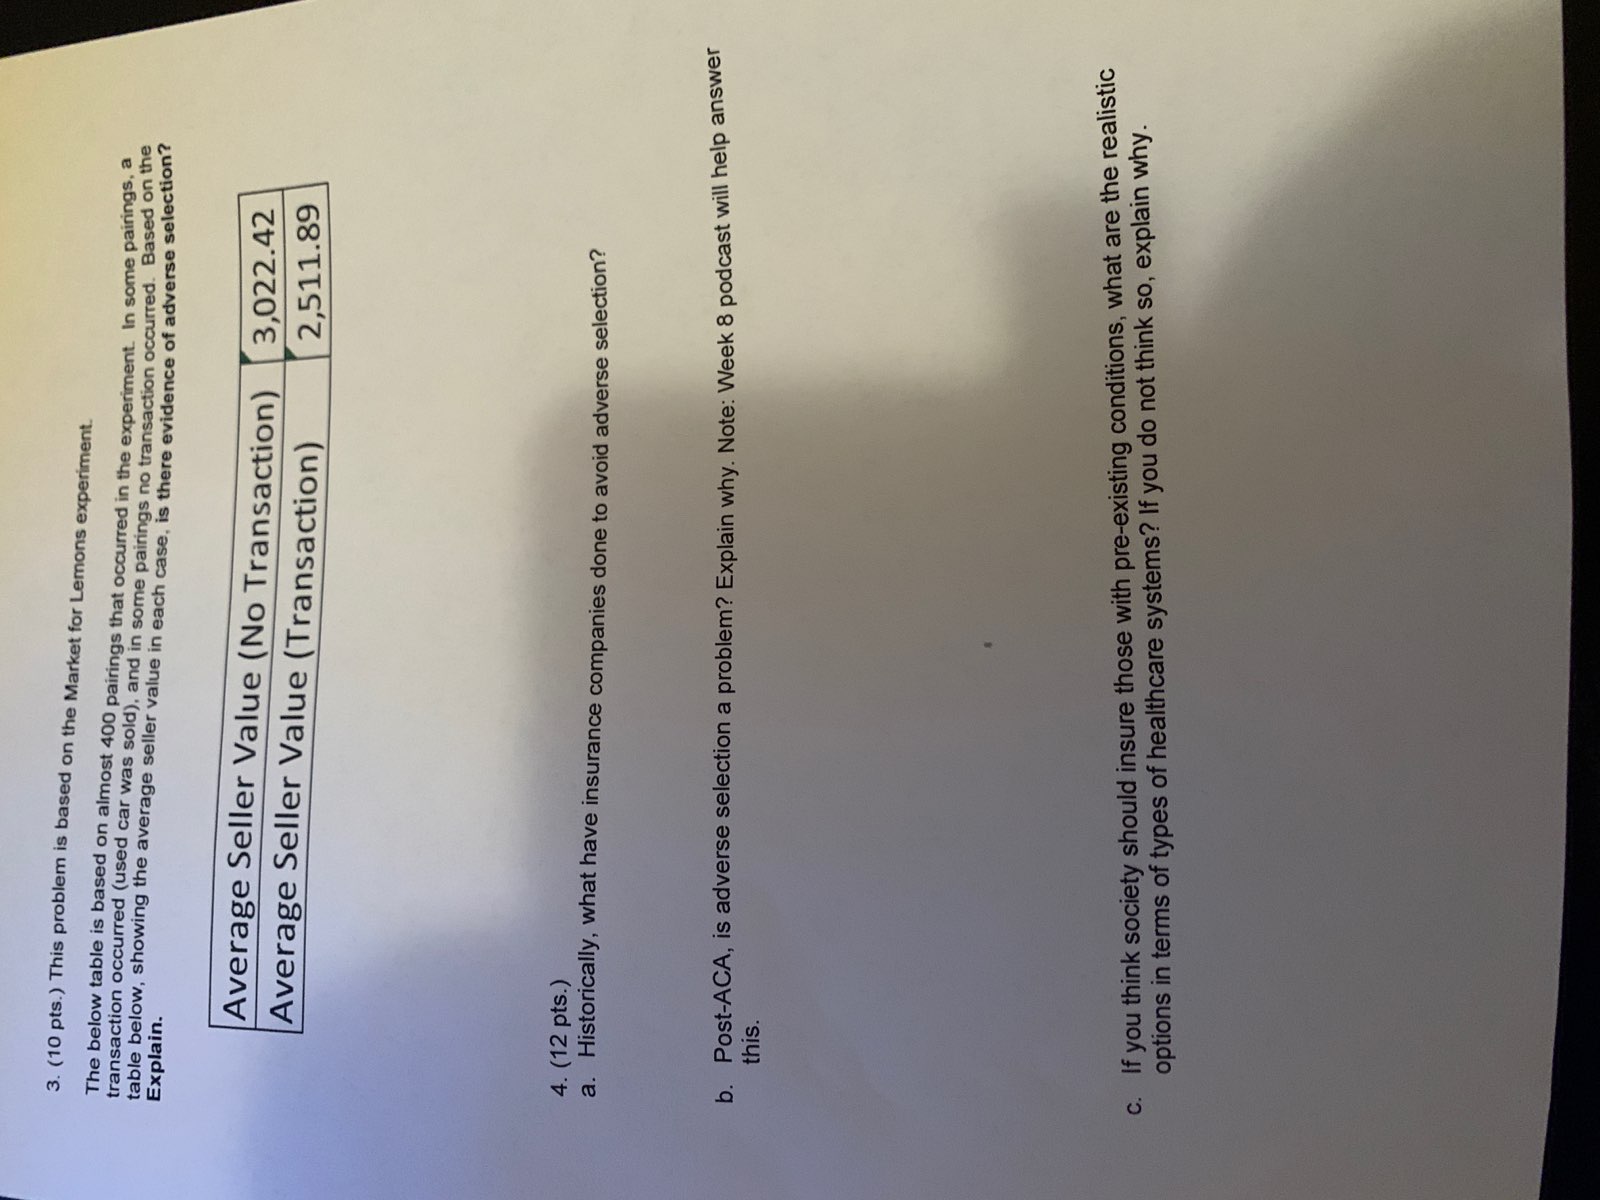
b. (10 pts.) Here are the graphical results of the Insurance Market experiment. How do these results relate to your answer in part a.? Is there evidence of adverse selection? Aggregate Avg. House Value ($1000) 200 2000 160 1800 1600 120 1400 1200 1000 800 600 400 O -200 400 -600 -800 -1000 -1200 -1400 -1600 -1800 -2000 -2200 70 80 90 -2400 10 20 30 40 50 60 100 Premium - Avg House Value .Mean . Profit -SD House Value3. (10 pts.) This problem is based on the Market for Lemons experiment. The below table is based on almost 400 pairings that occurred in the experiment. In some pairings, a transaction occurred (used car was sold), and in some pairings no transaction occurred. Based on the Explain. table below, showing the average seller value in each case, is there evidence of adverse selection? Average Seller Value (No Transaction) 3,022.42 Average Seller Value (Transaction) 2,511.89 4. (12 pts.) a. Historically, what have insurance companies done to avoid adverse selection? b. Post-ACA, is adverse selection a problem? Explain why. Note: Week 8 podcast will help answer this. c. If you think society should insure those with pre-existing conditions, what are the realistic options in terms of types of healthcare systems? If you do not think so, explain why
Step by Step Solution
There are 3 Steps involved in it

Get step-by-step solutions from verified subject matter experts