

Question: Having some trouble with the 4 questions found below, not sure how to extract the data and to get a bar graph or how to
Having some trouble with the 4 questions found below, not sure how to extract the data and to get a bar graph or how to find the percentages. All information needed is found in the image that contains the paragraph, the chart with data. hope someone can help me out please and thank you.

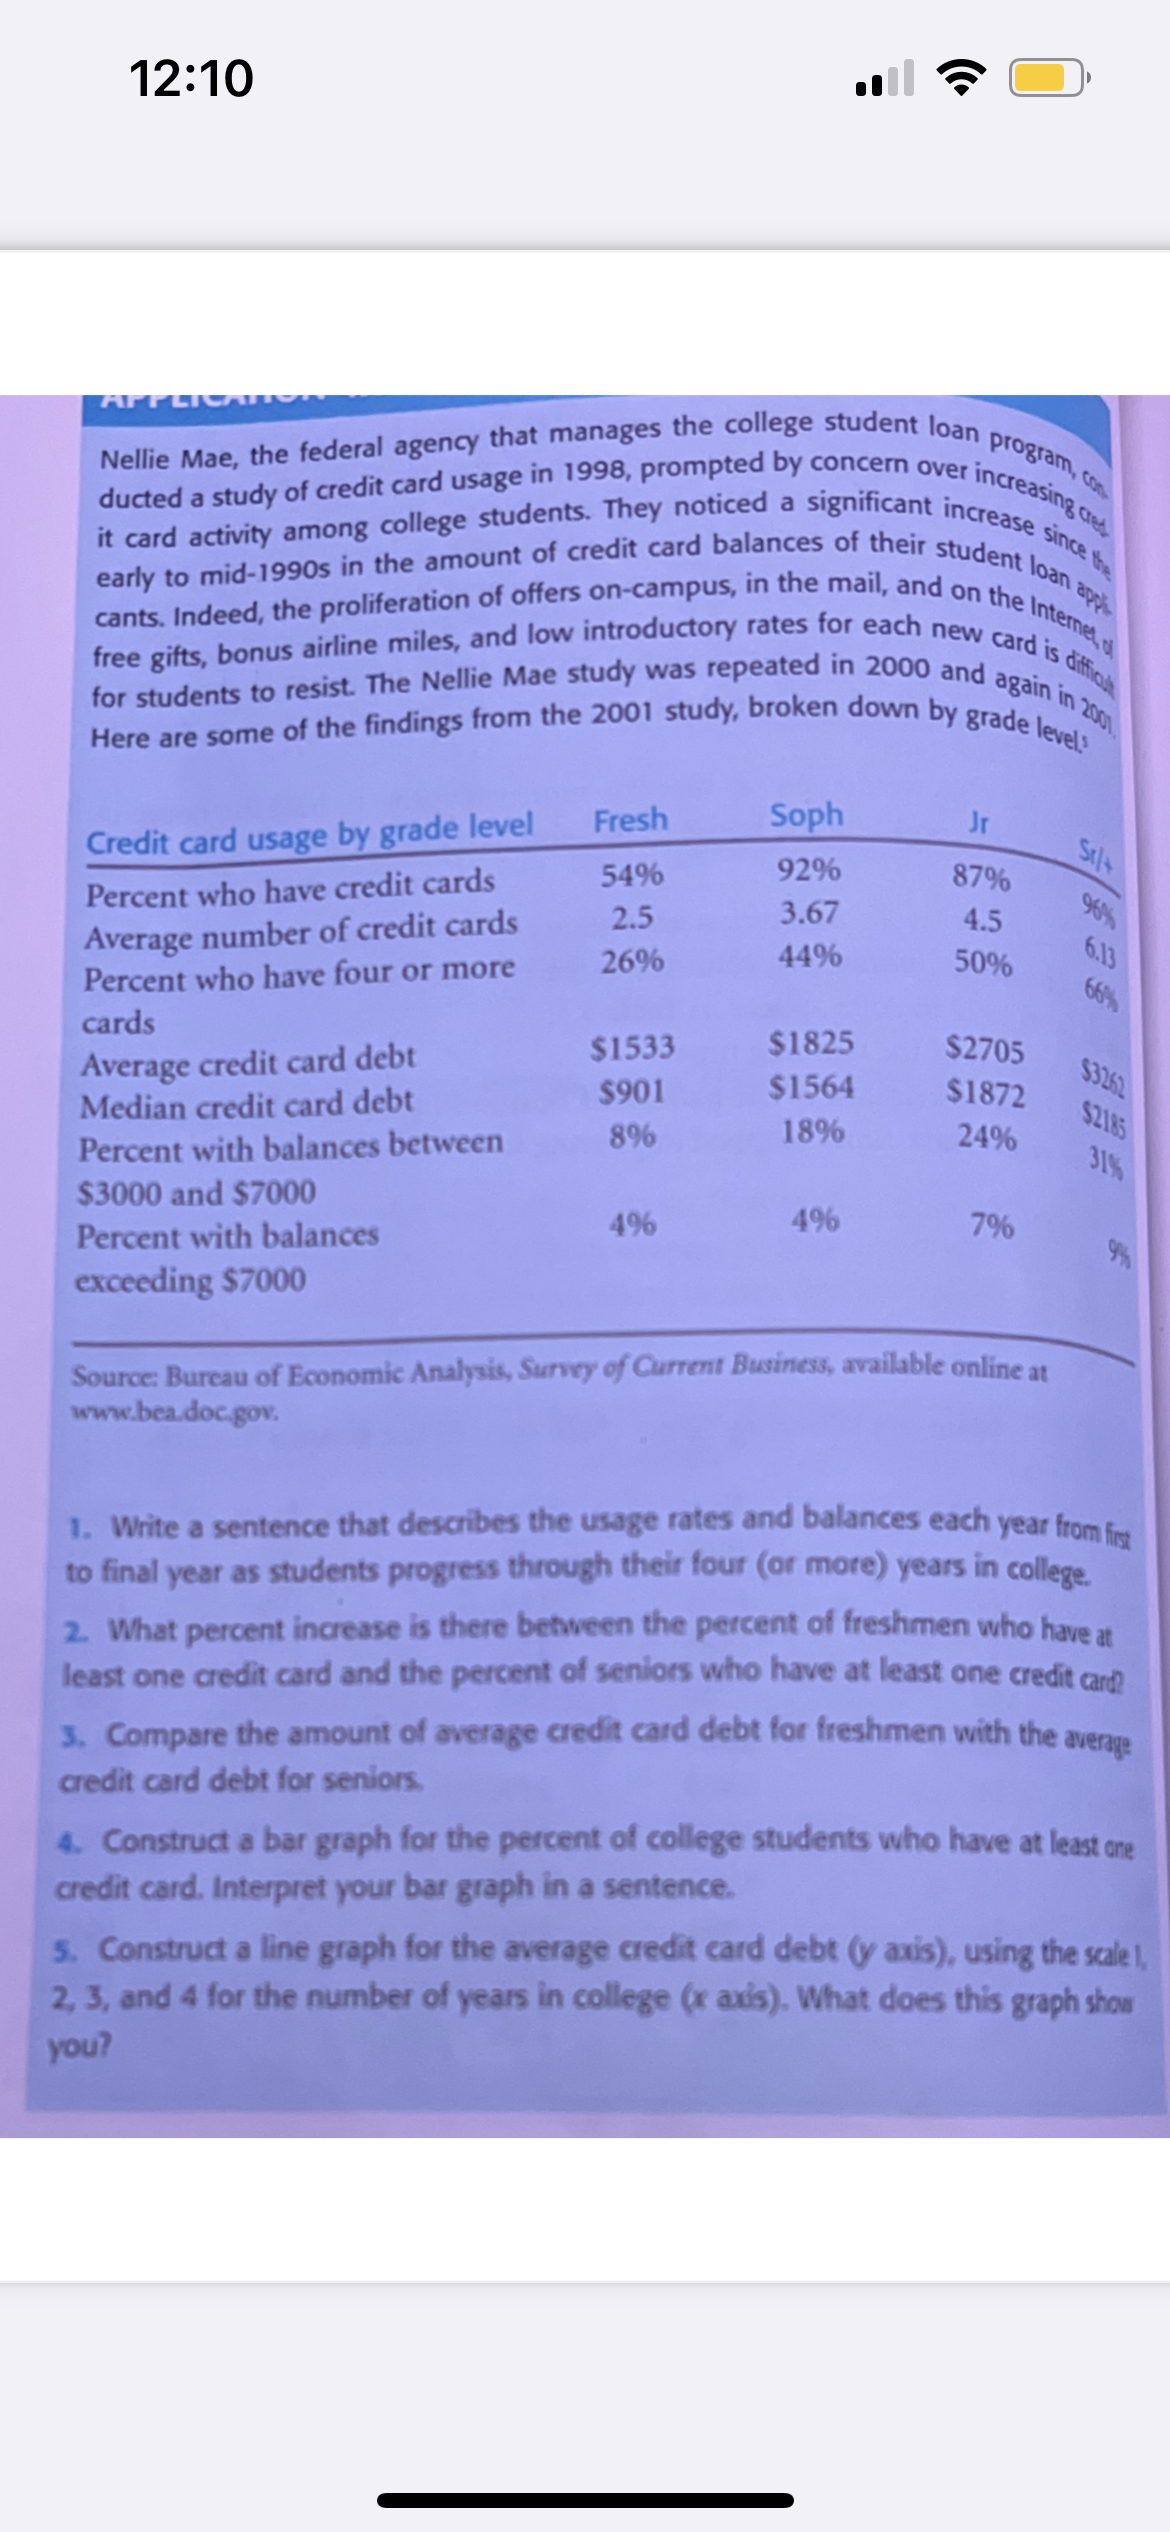
12:10 Nellie Mae, the federal agency that manages the college student loan program,. ducted a study of credit card usage in 1998, prompted by concern over increasing,it it card activity among college students. They noticed a significant increase since early to mid-1990s in the amount of credit card balances of their student loan get cants. Indeed, the proliferation of offers on-campus, in the mail, and on the Internal free gifts, bonus airline miles, and low introductory rates for each new card is diff for students to resist. The Nellie Mae study was repeated in 2000 and again in you Here are some of the findings from the 2001 study, broken down by grade levels Credit card usage by grade level Fresh Soph Jr Percent who have credit cards 54% 92% Silt 87% Average number of credit cards 2.5 3.67 4.5 96%% Percent who have four or more 26% 44% 50% 6.13 66% cards Average credit card debt $1533 $1825 $2705 Median credit card debt $901 $1564 $1872 $3262 Percent with balances between 8% 18% 24% $2185 $3000 and $7000 Percent with balances 4% 4% 7% exceeding $7000 Source: Bureau of Economic Analysis, Survey of Current Business, available online at www.bea.doc.gov. 1. Write a sentence that describes the usage rates and balances each year from first to final year as students progress through their four (or more) years in college. 2. What percent increase is there between the percent of freshmen who have at least one credit card and the percent of seniors who have at least one credit card? 3. Compare the amount of average credit card debt for freshmen with the average credit card debt for seniors. 4. Construct a bar graph for the percent of college students who have at least one credit card. Interpret your bar graph in a sentence. 5. Construct a line graph for the average credit card debt (y axis), using the scale 1, 2, 3, and 4 for the number of years in college (x axis). What does this graph show you
Step by Step Solution
There are 3 Steps involved in it

Get step-by-step solutions from verified subject matter experts