

Question: having trouble with a few problems for problem 1 am unsure for problem two each question has the same dropbox its just matching, problem three


having trouble with a few problems for problem 1 am unsure for problem two each question has the same dropbox its just matching, problem three there are graphs A-E both pictures are attached, please show work so i can follow and understand material and study some more i have been stuck for hours thank you for your time. Formula of superposition of two waves y1 and y2 are y1?=sin(?x?2?t) y2?=sin(?x/2?+2?t)
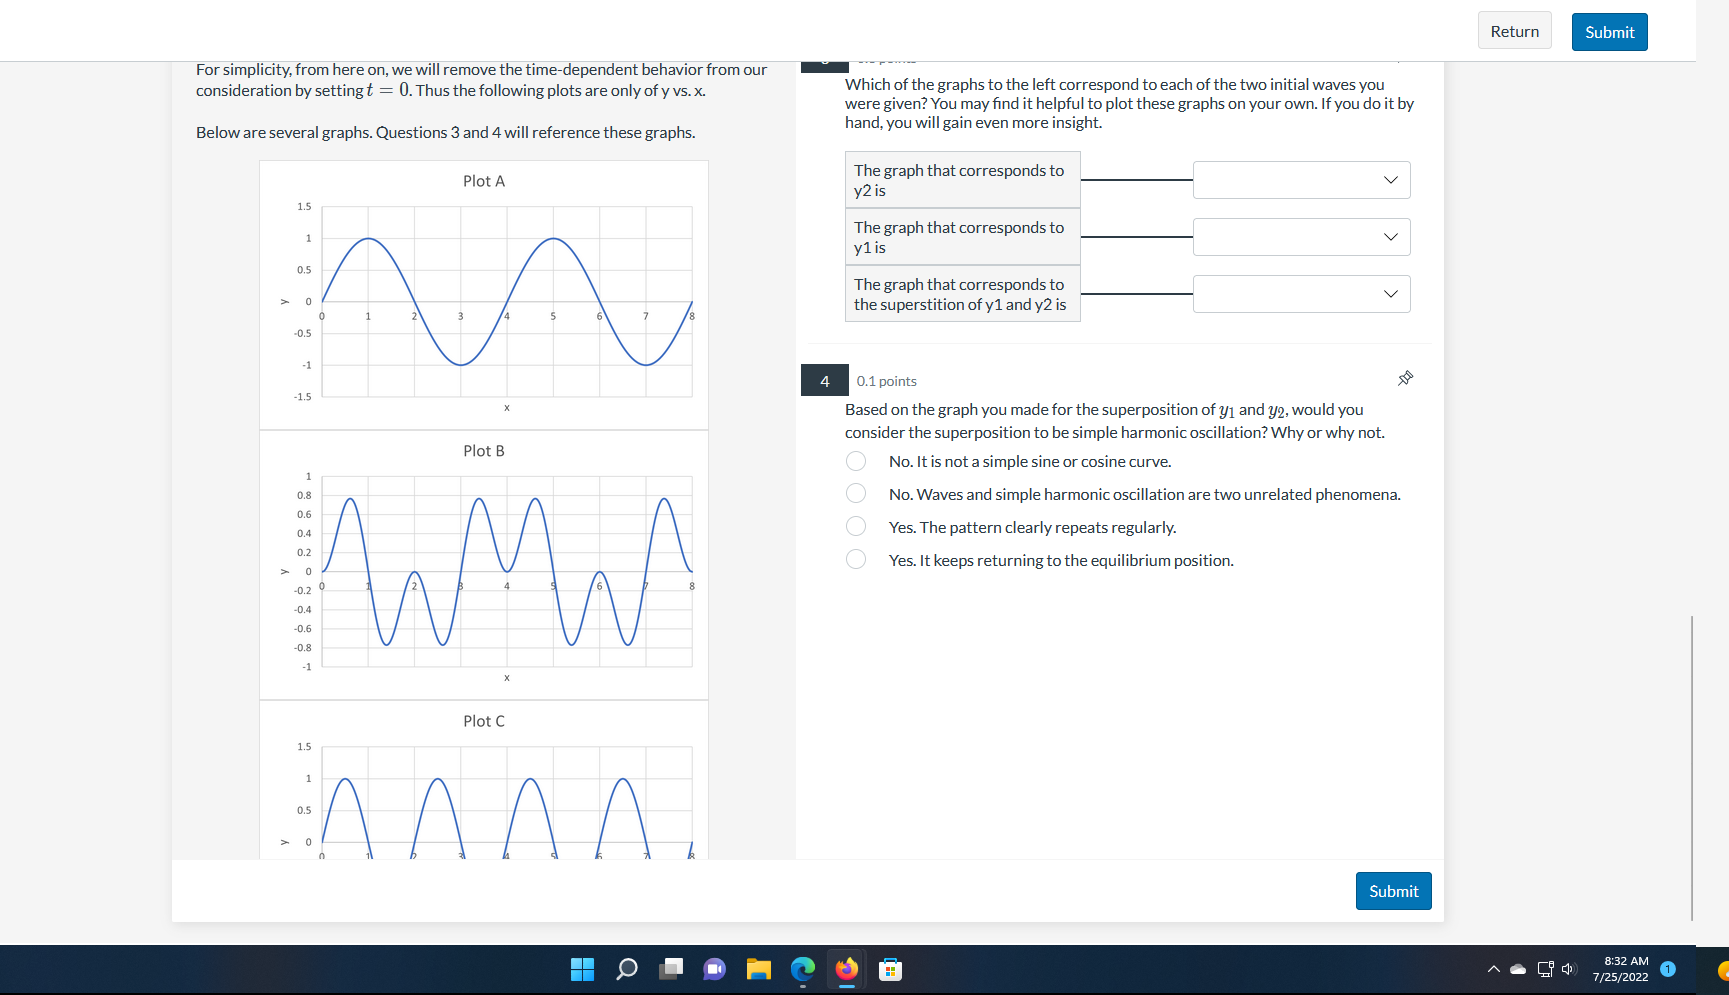
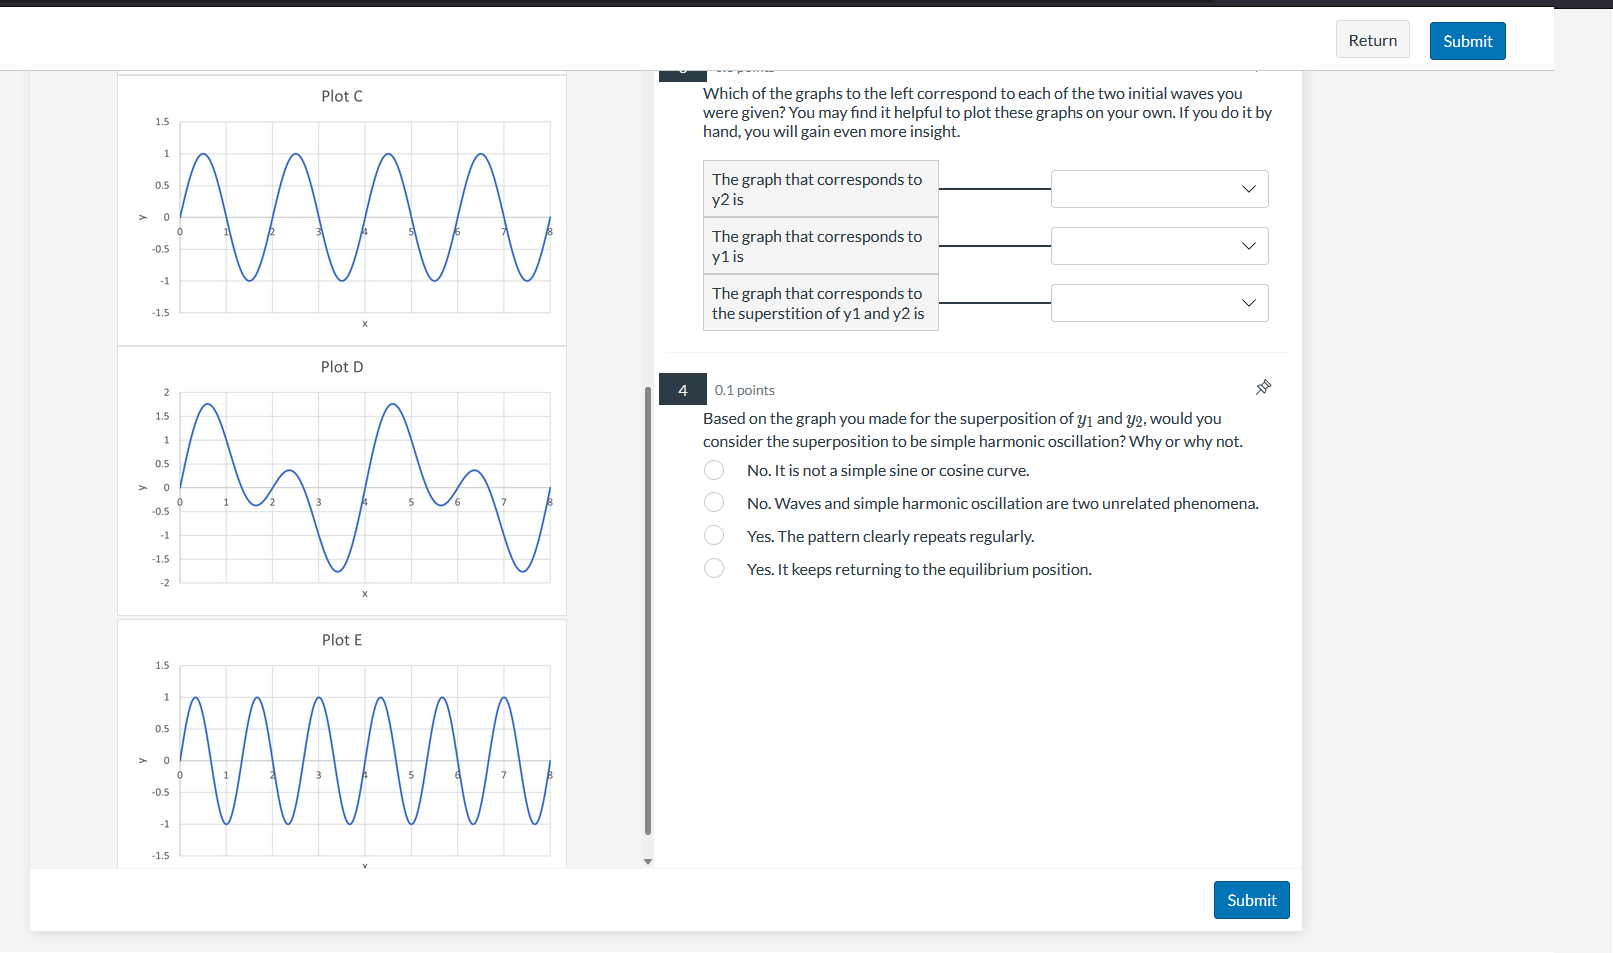
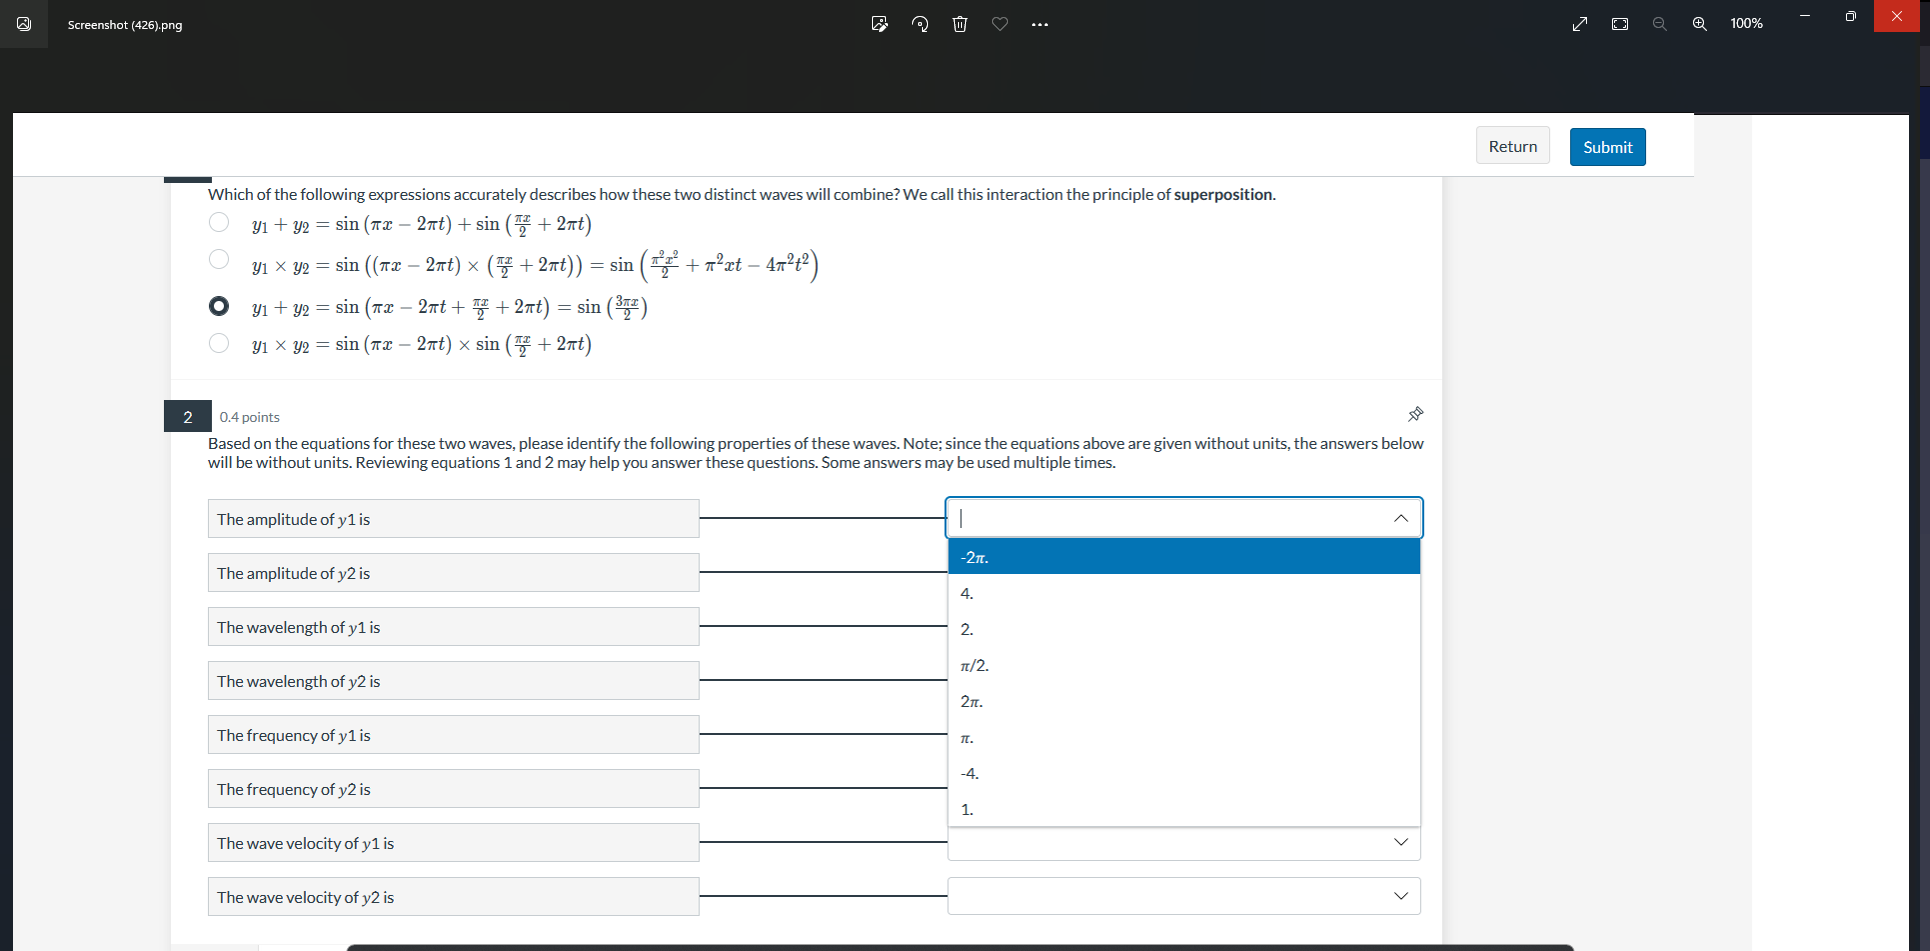
Return Submit For simplicity, from here on, we will remove the time-dependent behavior from our consideration by setting t = 0. Thus the following plots are only of y vs. x. Which of the graphs to the left correspond to each of the two initial waves you were given? You may find it helpful to plot these graphs on your own. If you do it by Below are several graphs. Questions 3 and 4 will reference these graphs. hand, you will gain even more insight. Plot A The graph that corresponds to y2 is 1.5 The graph that corresponds to y1 is The graph that corresponds to 0 the superstition of y1 and y2 is -0.5 -1 4 0.1 points -1.5 Based on the graph you made for the superposition of y1 and y2, would you consider the superposition to be simple harmonic oscillation? Why or why not. Plot B O No. It is not a simple sine or cosine curve. 0.8 O No. Waves and simple harmonic oscillation are two unrelated phenomena. 0.6 0.4 O Yes. The pattern clearly repeats regularly. O 0 Yes. It keeps returning to the equilibrium position. 20 -0.2 -0.4 -0.6 -0.8 Plot C 1.5 AAAA Submit 8:32 AM 7/25/2022 1Return Submit Plot C Which of the graphs to the left correspond to each of the two initial waves you were given? You may find it helpful to plot these graphs on your own. If you do it by 1.5 hand, you will gain even more insight. 0.5 The graph that corresponds to y2 is The graph that corresponds to V -0.5 y1 is -1 The graph that corresponds to -1.5 the superstition of y1 and y2 is Plot D 4 0.1 points Based on the graph you made for the superposition of y1 and y2, would you consider the superposition to be simple harmonic oscillation? Why or why not. 0.5 O No. It is not a simple sine or cosine curve. o O .0.5 No. Waves and simple harmonic oscillation are two unrelated phenomena. Yes. The pattern clearly repeats regularly. -1.5 O Yes. It keeps returning to the equilibrium position. -2 Plot E 1.5 0.5 0 -0.5 -1 -1.5 SubmitScreenshot (426).png 100% X Return Submit Which of the following expressions accurately describes how these two distinct waves will combine? We call this interaction the principle of superposition. O y1 + y2 = sin (na - 2nt) + sin ( + 2nt) y1 x y2 = sin ((nx - 2nt) x ("# + 2nt) ) = sin (@2 + 72at - 472+2) O y1 + y2 = sin (x - 2nt + + 2nt) = sin (3qx) O y1 x y2 = sin (nx - 2nt) x sin ( + 2nt) 2 0.4 points Based on the equations for these two waves, please identify the following properties of these waves. Note; since the equations above are given without units, the answers below will be without units. Reviewing equations 1 and 2 may help you answer these questions. Some answers may be used multiple times. The amplitude of y 1 is 2IT. The amplitude of y2 is 4 The wavelength of y1 is 2. TT/2. The wavelength of y2 is 21. The frequency of y1 is -4. The frequency of y2 is 1 . The wave velocity of y1 is The wave velocity of y2 is
Step by Step Solution
There are 3 Steps involved in it

Get step-by-step solutions from verified subject matter experts