

Haynes et al. 1995 carried out a pilot study to test for differences between sites in trace
Question:
Haynes et al. 1995 carried out a pilot study to test for differences between sites in trace metal concentrations in marine sediments off the Victorian coast in southern Australia. They had three sites: Delray Beach, site of a proposed wastewater outfall, and two possible control sites, Seaspray and Woodside. At each site, they recorded concentrations of copper, chromium, cadmium, lead, iron, nickel, manganese and mercury (means of two sediment cores) at four randomly chosen stations. There were strong correlations among some of the metals (e.g., Cu and Cr, Fe and Ni) so only four variables (Cu, Ni, Pb, Mn) were included in the analysis. In addition, there was a strong indication of skewness for the four variables, so all were log transformed. Since jamovi doesn’t yet do a very good job for Discriminant Analysis, I’ll give you some output here showing results from an SPSS discriminant analysis using the log transformed variables (LCU, LPB, LNI, LMN) and the site_num as the variable to group. Results include a new column that says which group they belong
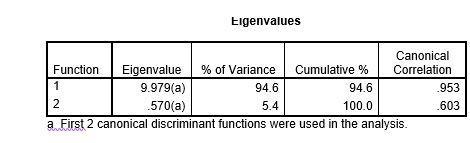
15. Here is the eigenvalues chart. What does this mean? How many new axes do you need to consider for this analysis?
Expert Answer:
The environment is longstanding even within the sea but some 50 years ago awareness of human degrada... View the full answer


