

Question: he blue curve depicts the change in the future value of $1 with compound interest. Move the silder to raph to select dferent time periods
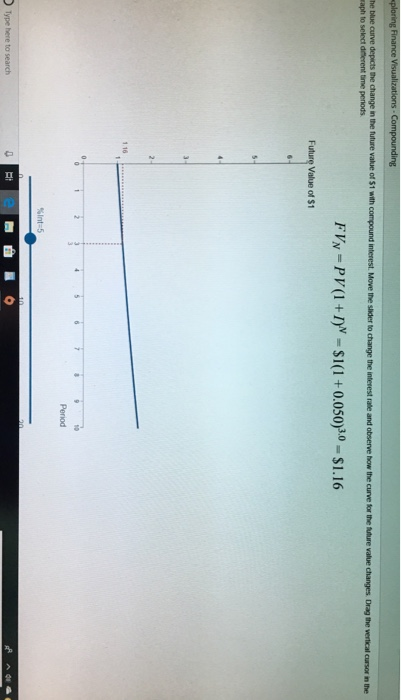
he blue curve depicts the change in the future value of $1 with compound interest. Move the silder to raph to select dferent time periods FVN-PV(1+T S1(1+0.050)30 S1.16 Future Value of $1 1 16 Period sint: 5 Type here to search
Step by Step Solution
There are 3 Steps involved in it
1 Expert Approved Answer
Step: 1 Unlock

Question Has Been Solved by an Expert!
Get step-by-step solutions from verified subject matter experts
Step: 2 Unlock
Step: 3 Unlock